


Why Market Trends Matter for Every Trader
You're standing by the river, ready to swim upstream or downstream. Which seems easier? Trading against market trends is like swimming upstream – difficult and often pointless. Trading with trends, on the other hand, is like floating downstream to your destination.
When it comes to financial markets, a trend refers to the general direction of price movements over time. Whether you are trading forex pairs, CFDs, or cryptocurrency, trends don't just help you - they are necessary for your survival. Trends tell you where momentum is going in a market.
Consider Bitcoin's incredible run from $1,000 to just shy of $20,000 dollars in 2017 - that did not happen by coincidence, it was a steep uptrend largely as a result of institutional adoption, media hype, and FOMO (Fear of missing out). Traders who recognized that opportunity and were able to ride that trend made lots of money. Those who fought the trend? Let's just say they learned some expensive lessons.
This guide will break down everything you need to know about market trends: the three major types (uptrend, downtrend, and sideways), how to identify them, navigate market trends with proven tools, and teach real strategies. By the end of this guide you will be thinking like a professional trader and be looking for opportunity in what at first seems like chaos.
What Is a Market Trend? Breaking It Down Simply
Market trends come in three strengths. Any price movement you ever see will fall into one of these three categories.
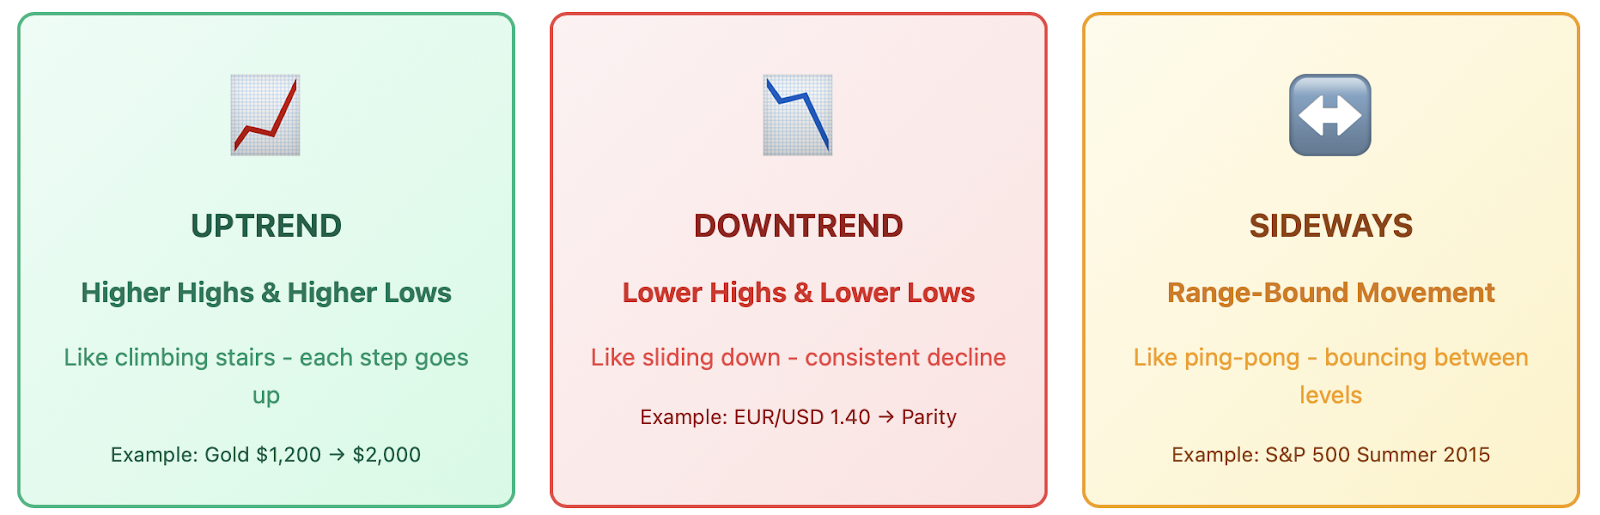
Uptrend (bullish market) An uptrend is like climbing a staircase. Prices are making higher highs and higher lows along the way. Even when the market pulls back, overall price will not pull below the recent low and push a new high. Gold is a great example, which has moved from $1,200 levels to $2,000 over past couple of years.
Downtrend (bearish market) A downtrend is like a slide at at playground. In this trend, price consistently makes lower highs and lower lows. A great downtrend is the EUR/USD pair's huge drop from 2014 to 2015, from 1.40 until it was near parity.
Sideways Trend (range-bound market) Sometimes, markets get stuck in a box, bouncing back and forth between support and resistance levels like a ping-pong ball. The S&P 500 oscillated in this sideways range most of the summer of 2015, to the dismay of every trend follower, but the delight of the range-bound trader.
Pros and amateurs are separated by one thing: pros don't fight the trend. When Tesla stock was in an uptrend in 2020, smart traders were not trying to short the "overvalued" stock. See the market can remain irrational longer than you can remain solvent.
Each trend type has its own strategy and mindset. In uptrends, patience and buying the dip is rewarded. In downtrends, short sellers and protective strategies will prevail. In a sideways market, scalpers and range traders are happy to take advantage of price bounces.
Why trends form: The psychology behind the market.
Markets do not move randomly, they are driven by human emotions which are carried out by economic forces that create patterns which ultimately can be predictable.
Supply and Demand Imbalances When there are more buyers than sellers, prices will increase. When there are more sellers than buyers, prices will decrease. This may sound simple but there is a "why" behind these supply and demand imbalances and this is where the real story is.
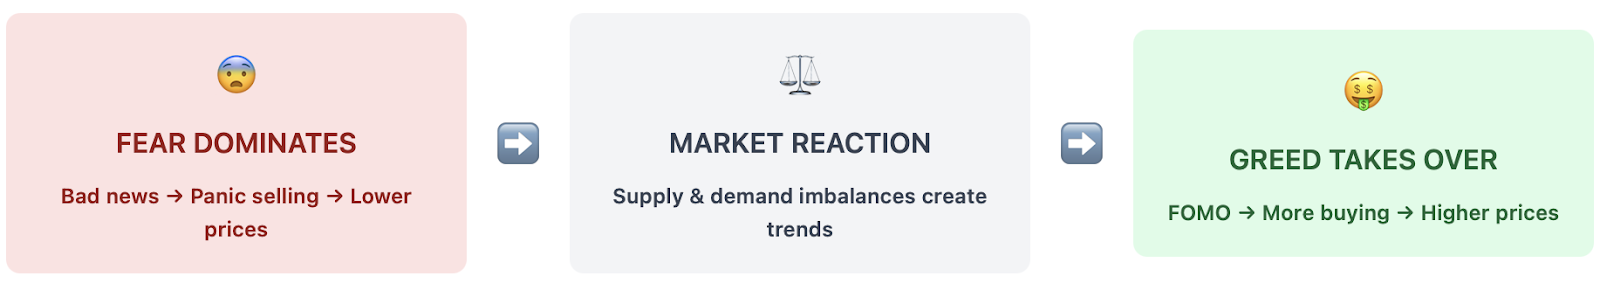
Psychology in the Market Fear and greed generally drive market moves. If greed is driving the move, the market is typically in an uptrend. Investors see prices are rising and buy because they are afraid of missing out. When greed drives the market, this creates more buyers and increased buying pressure ultimately pushing prices higher. Uptrends emerge during a market like a snowball going downhill.
Fear dominates when markets are in downtrends. Bad news strikes, you see prices decline, selling takes place, and panic selling begins. As sellers create more and more sell waves, each wave breeds fear in the market, which sparks additional selling. You can see this cycle operate in graphic detail in the 2008 financial crisis.
Real World Market Triggers Central banks announce rate changes, economic reports are released, geopolitical events take place, and the occasional tweet from a famous person can also trigger trends in financial markets.
If the Federal Reserve indicates that it may potentially raise interest rates, the dollar can trend for weeks. If an oil-producing region experiences turmoil, the energy sector can trend downwards for months.
Again, consider high school trends. When one popular student wears a style of clothing that catches on, many other students imitate the style, and before long, half the school has adopted the same look. The same thing happens in the market. Early adopters spread the trend, which leads to momentum feeding on itself and creating more momentum in price, through time and for a variety of reasons.
The one big takeaway: trends are not simply trend lines on a chart. Trends are the result of millions of people making decisions based on emptions, news and economic realities. Understanding the psychology to any trend will help you better understand when trends stand a chance to continue or potentially reverse direction.
Identifying Market Trends Like a Pro
Identifying trends involves having the tools and knowing how to use them, so let's look at your professional toolkit:
Moving Averages: Your Trend Satellite Moving averages help you to smooth away price noise and see the true direction of price. The 50-day and 200-day moving averages are widely used. When a price trades above the 200-day moving average, you are likely in an uptrend. When it is below the 200-day moving average?
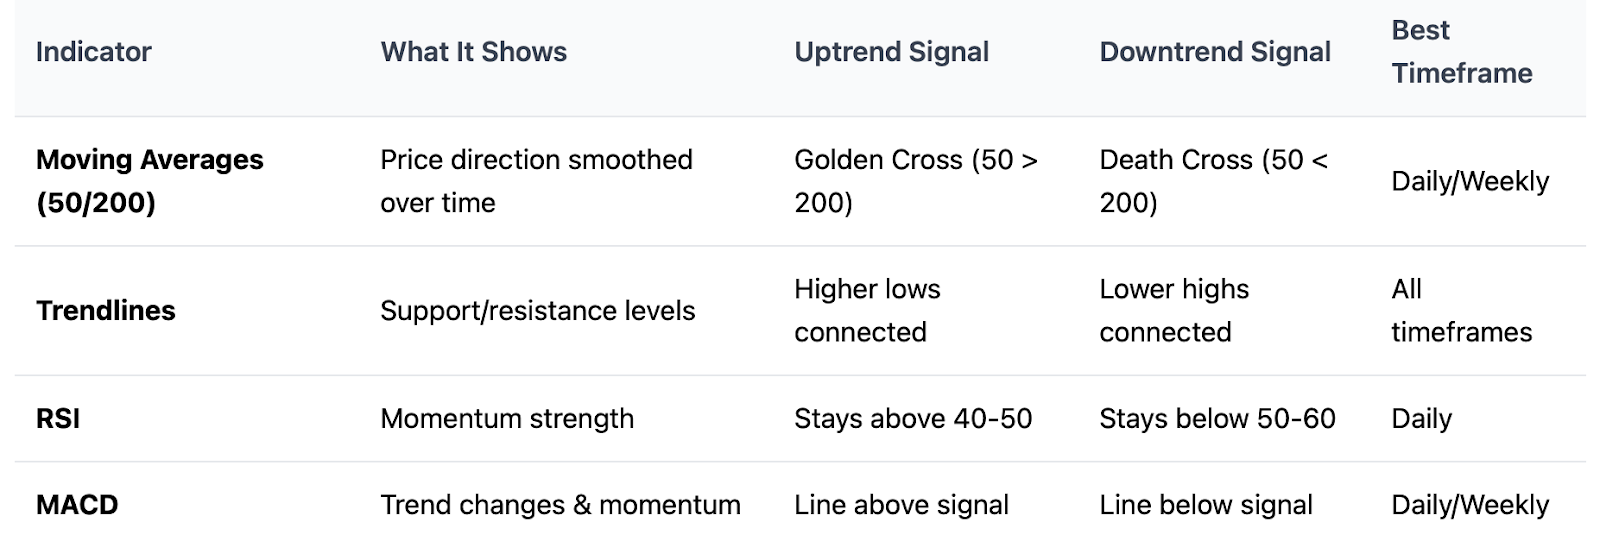
You are likely in a downtrend. The "golden cross" is where the 50-day moving average crosses above the 200-day. The golden cross is seen as the start of a major uptrend. Conversely, the "death cross" is when the 50-day crosses under the 200-day moving average and can be seen as a potential downtrend. When NASDAQ had a golden cross in late 2016, it preceded a powerful bull run.
Trendlines: Draw Connecting Lines You can establish the trend by drawing lines that connect the swing lows in a swing uptrend or swing highs in a swing downtrend. Valid trendlines require a minimum of two points, and the more confirmations providing validation (three or more) the better the trendline. Price is more inclined to reverse directions when breaking a trendline with conviction.
Momentum Indicators: Identify What You Have just Seen Indicators such as RSI (relative Strength Index) and MACD provide some confirmation of trend strength. In heavily upward trending environments, RSI will typically remain above 40-50, and will repeatedly reach an overbought level. In downward trending environments, RSI will typically stay below 60.
Common Mistakes to Avoid
-
Don't depend on one left for guidance.
-
The movement of the markets is multifaceted, no one tool is infallible.
-
Any short term noise will create bad signals, that is why we want to use longer time frames to identify the trends.
-
The EUR/USD pair may look bearish on a 5 minute chart, but bullish when we look at the daily.
Newbie traders often confuse the normal pullback and profit-taking caution traders perform for a new trend. Healthy uptrends will normally pullback anywhere from 38-50% of the previous move before continuing back up. These pullbacks present buying opportunities, not new sell signals.
Putting It All Together Professional traders look for multiple confirmations. They will wait until price has broken a trendline, the 50-day MA has crossed above the 200-day MA, and the RSI shows bullish momentum before entering their position. All of these confirmations together give the trade a better probability of success and lower the chance of false signals.
Trading Strategies Based on Trends
Now that you can source trends visually, this section will build upon that foundation of recognizing trends and we will discuss how to capitalize on them.
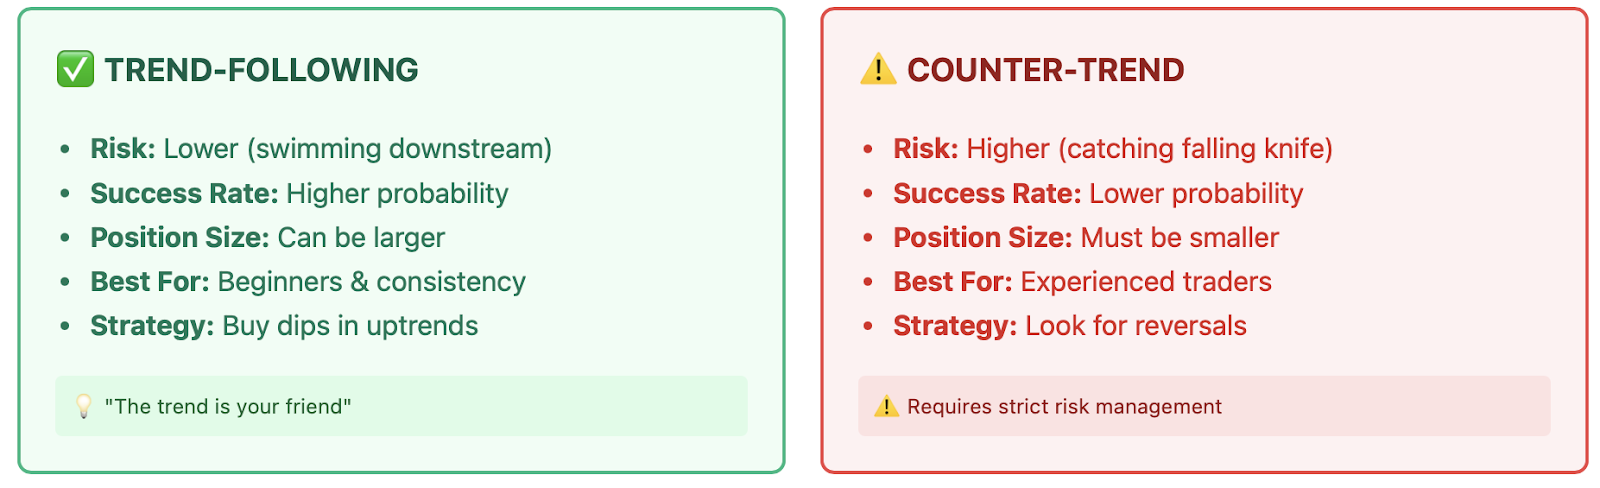
Trend-Following (The Path of Least Resistance): The simplest strategy is you buy uptrends and sell downtrends. It is simply follow the path of least resistance. Riding a wave instead of fighting it. Those fortunate enough to be a trend-follower in the 2020-2021 bull run of Bitcoin were rewarded very well. Those who bought during pullbacks, kept their nerve, and even bought through down days captured an enormous payday!
Timing your entry is important. Don't chase prices in extreme highs or lows. You'll have to wait for pullback if you entered in an uptrend, and a bounce if you entered in a downtrend. A pullback or a bounce against a stronger trend is just a temporary measure that opens better entry prices with better risk-reward ratios.
Placing Stop-Loss: Your Insurance Policy
You want to place your stops below recent swing lows in an uptrend, and above recent swing highs in a downtrend. This way, you are protected in case the trend breaks with your trade entry. Many traders will use the 2% rule, that is, they never risk more than 2% of their account on a single trade.
Counter-Trend Trading: High Risk, with High Reward
There are a few traders who are experienced enough to profit by taking trades in the opposite direction of the trend to look for reversal or temporary corrections in a stock sector or commodity for instance. You need to get good at flags, pennants, divergence, rotation, oscillators, and very strict money management rules because counter trend trading is all about timing - something like trying to catch a falling knife - risky and difficult to do!
Counter-trend strategies will work best in sideways markets, where price will bounce and fluctuate between support and resistance. You can absolutely lose money trying to trade against a trend, and even professional traders will lose money every day when trying to fight trends. "The trend is your friend until the end," is the saying.
Size of Position and Risk Management
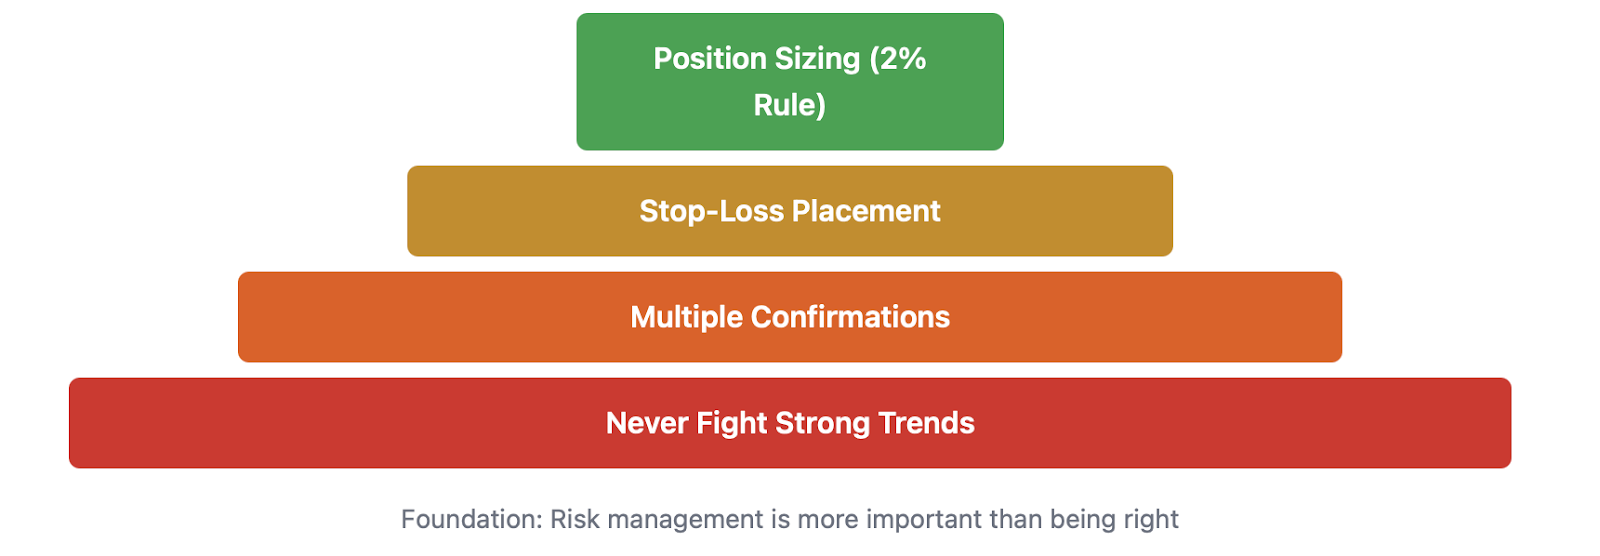
The fundamental difference between trend-following and counter-trend trading is the fact that trend-following allows you to increase position size, as you are trading with the odds in your favor, while counter-trend trading requires smaller position size because it is much riskier. No matter how strong a trade setup looks, never put too much risk on a trade.
Practical Examples
For those of you who have traded any amount of time, you should remember the Bitcoin bull run of 2017. Trend-followers simply bought every dip in Bitcoin and held through minor draw-downs while all the naysayers talked about "bubbles" and how prices were so "overvalued", until there was clear and obvious trend reversal signals. Trend-following worked like a charm all the way up until the trend finally broke in early 2018.
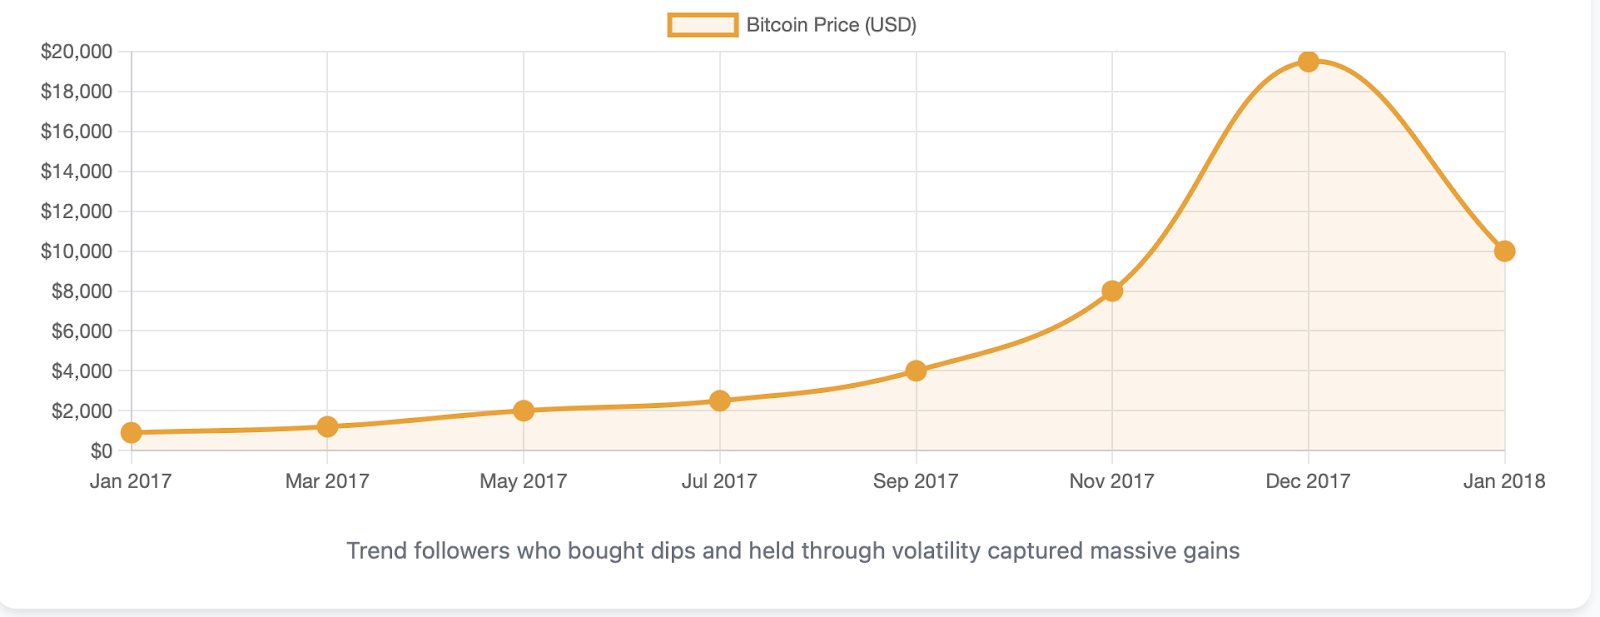
The point? Trends last longer than most people expect, but riding the trend requires patience and discipline to ignore what everyone is so afraid of in the short term.
Actual Case Studies: Trends in Action
Now, let us look at some actual examples that illustrate how trends play out in various markets.
Forex: EUR/USD Multi-Year Downtrend (2014-2016)
The euro's decline against the dollar created one of the most persistent trends in modern forex history. The pair started off at 1.40 in 2014, and fell unstoppably until it reached parity around 2016.
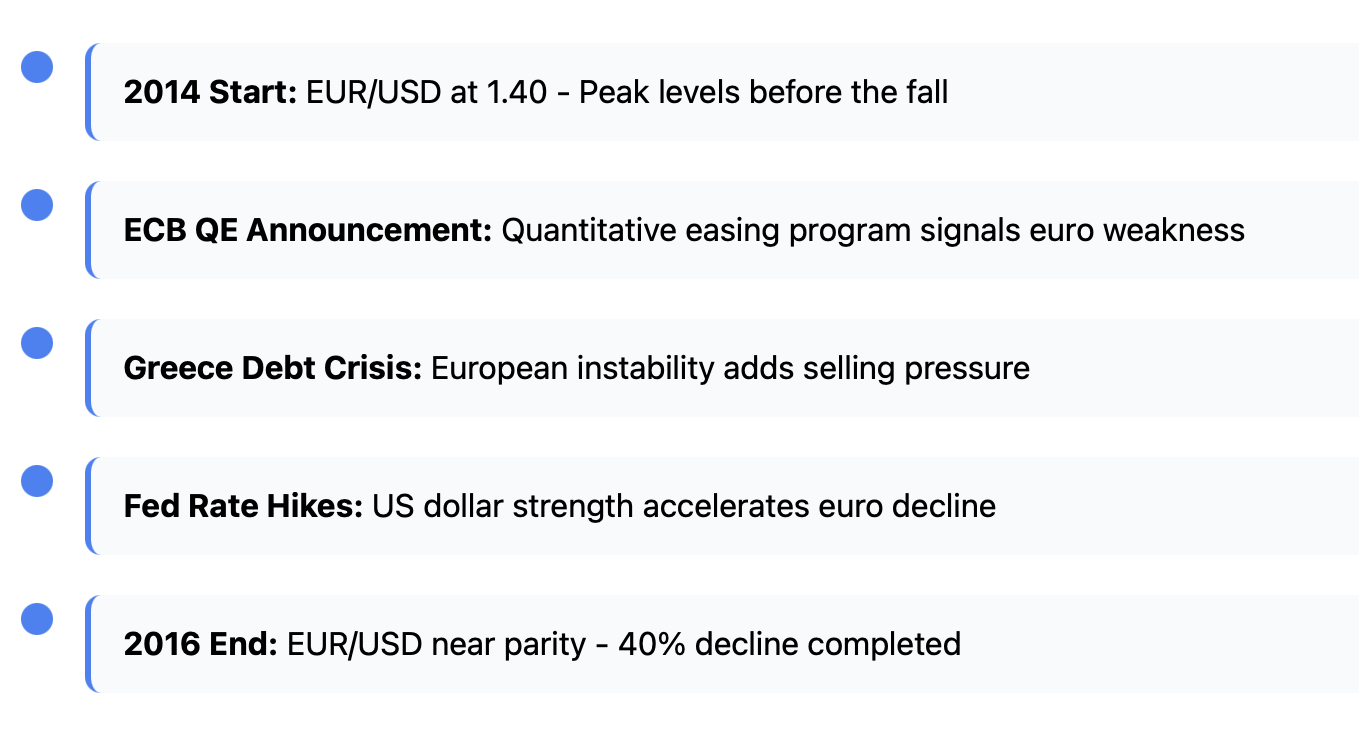
What caused this trend? The ECB, and their quantitative easing program, the Greece debt crisis, and the Federal Reserve rate hikes that eventually occurred. Traders who saw these fundamental factors and traded in-house have been able to profit considerably trading in the downtrend.
The trend was textbook: lower highs, lower lows, and failed attempts to bounce. Each time the pair tried to rally buyers were showing up at prior support (now resistance) levels. This gave the most patient traders numerous opportunities to short.
Cryptocurrency: The Halving Cycles of Bitcoin Bitcoin is programmed to "halve" its supply every 4 years through various events called "halvings". It's what causes the predicable trend cycles. The 2020 halving resulted in a massive bull market run from $10,000 to $60,000.
Knowledgeable crypto traders will often prepare for the halving cycles years in advance, they typically accumulate during the bear markets after the halving and then ride the trend up. It's like knowing when the seasonal trends will hit certain stocks.
Stocks: Tesla's 2020 breakout
Tesla stock went from roughly $180 to about $900 in 2020. This trend began when the company began reporting profitable quarters in succession, as well as incorporating into the S&P 500.
In the beginning, trend followers bought the stock whenever there was a breakout above a resistance level and remained in the trade no matter the volatility. A large part of the success was recognizing that Tesla changed from a cash-burning startup to a profitable growing company. The stock price had merely caught up to the realization.
Commodities: Oil's Pandemic Crash and Recovery Oil prices fell from $60 to negative dollars in 2020 and recovered to over $80 by 2021. This presented two completely separate trends - a deep downtrend manifested into a deep uptrend.
Traders who acted and recognized the recovery trend early based on the economic reopening and the sticking supply constraints made plenty of money. They merely waited for the trend to firmly establish itself instead of trying to pick a falling knife during the initial downside collapse.
These examples had some things in common: Strong fundamentals, clear technical patterns and the willingness to be patient. Successful trend trading is not about forecasting – it's about seeing the conditions that favor continued movement in one direction.
Your next steps to trend trading
Learning about market trends provides you with a massive edge in your trading but understanding alone is useless without doing. Trends are probabilities, not certainties. They're your best guess about future price path based upon current momentum and psychology in the marketplace.
Markets and timeframes exhibit three types of trends: uptrend, downtrend, and sideways. Just as important, learning how to use some moving averages, trendlines and momentum indicators will help you identify trends and develop a profitable trading plan.
Think of the analogy of a river. It is much easier to swim downstream than upstream. Trends occur because of the combined behavior of millions of market participants, and if you are able to trade with the trend, you're trading with the strongest force in the market.
Managing risk is always important. Even the strongest trends will end and no trading strategy works 100% of the time. You have to use stop-losses, position sizing and diversification to preserve your capital when trading does not go your way at times, which it usually does.
The most important thing is to practice. Backtest your strategies, conduct chart analysis and, if possible, paper trade. These actions will help you develop the pattern recognition skills that will set apart a profitable trader from a gambler.
Are you ready to start trading trends? BTCDana has sophisticated charting add-ons and up-to-the-minute market data you need to identify and trade market trends professionally.