


Introduction: Forex Technical Analysis
Technical analysis simply means the method of evaluating the financial market by using price and volume data to identify patterns and forecast future movements. Fundamental analysis deals with economic indicators, company financials, and geopolitical factors, while forex technical analysis focuses only on market behavior.
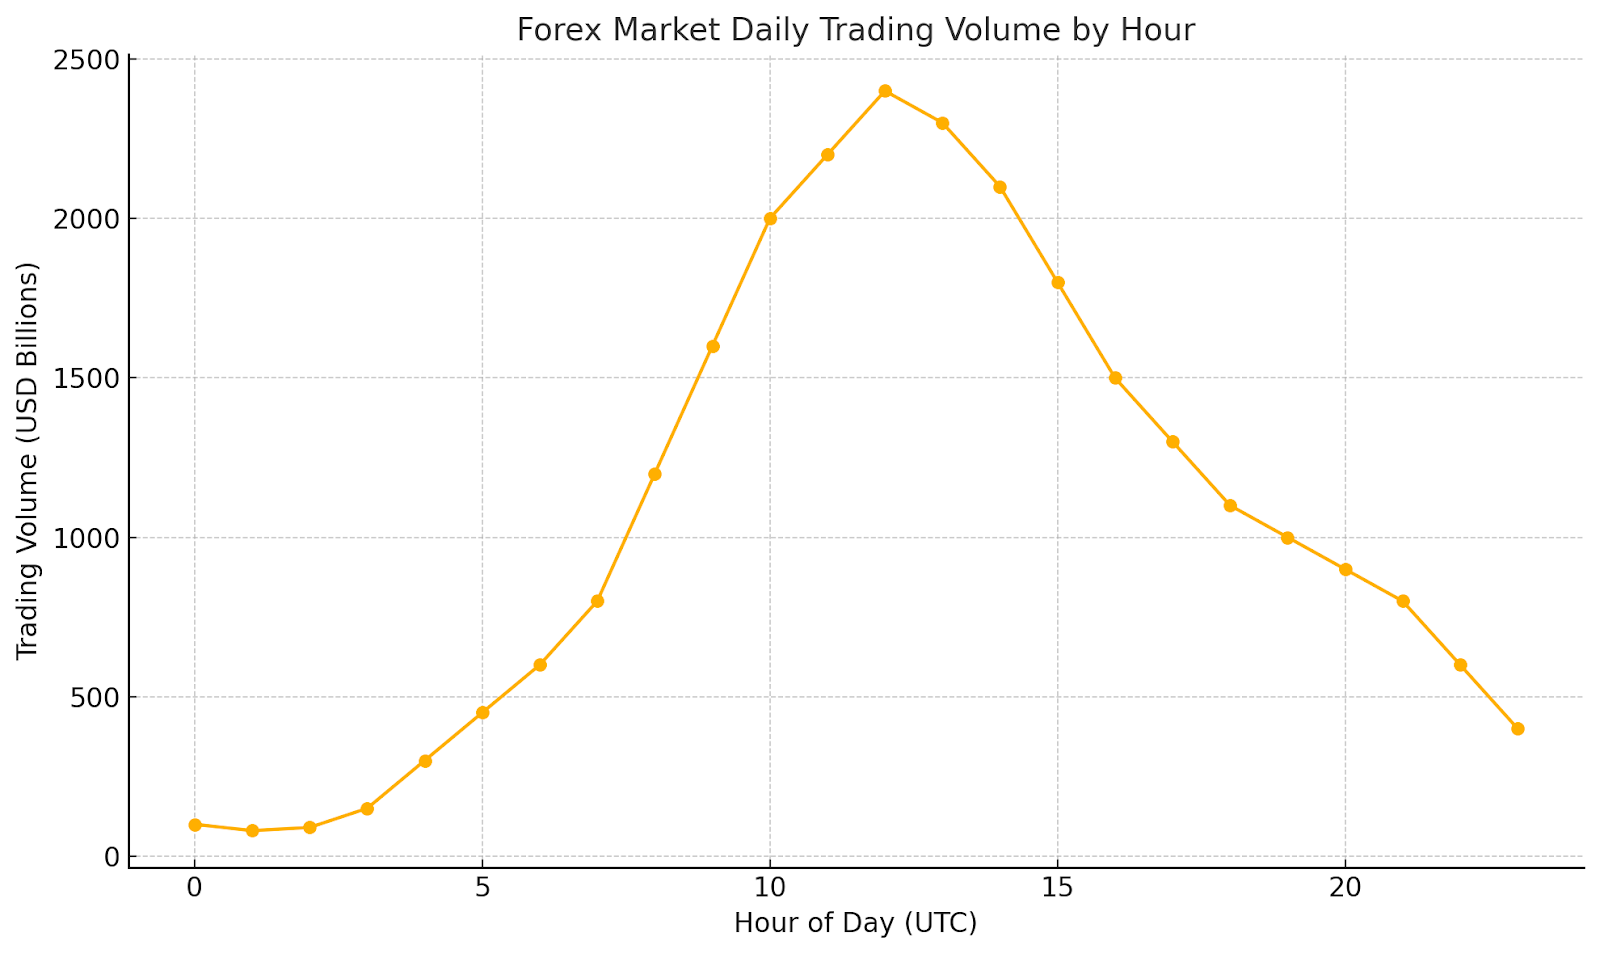
Since the forex market is so fast-paced and volatile, forex technical analysis is the most suited for it. The forex market is known for its high liquidity, 24-hour trading, and rapidly shifting trends; not only that, it boasts a daily trading volume exceeding $6 trillion.
All these characteristics of the forex market make technical indicators such as RSI and moving average critical tools for traders. These tools help traders make accurate forex market trend predictions across multiple timeframes.
Today, traders rely on these technical tools and chart patterns to make good decisions, improve their entry and exit timing, and manage risk effectively. In this blog, we will discuss core chart-analysis techniques, look into key indicators, and share practical strategies to help you apply technical analysis and achieve better results in your trading.
Core Principles of Technical Analysis
Technical analysis is based on the belief that market psychology and collective trader behavior can be seen in price movements and volume data. According to the brief form of the efficient market hypothesis, all available information is already reflected in the market action, which is why price charts are the main source of analysis.
Another concept to note is the trend theory, which implies that price moves in traceable directions, such as upward, downward, or sideways, and that it tends to continue in those trends until a clear reversal signal appears. Traders make use of these trajectories to validate entry and exit points.
Another key principle of technical analysis is that history tends to repeat itself. Patterns like head-and-shoulders or double tops start to show; this is because people react in predictable ways under similar conditions.
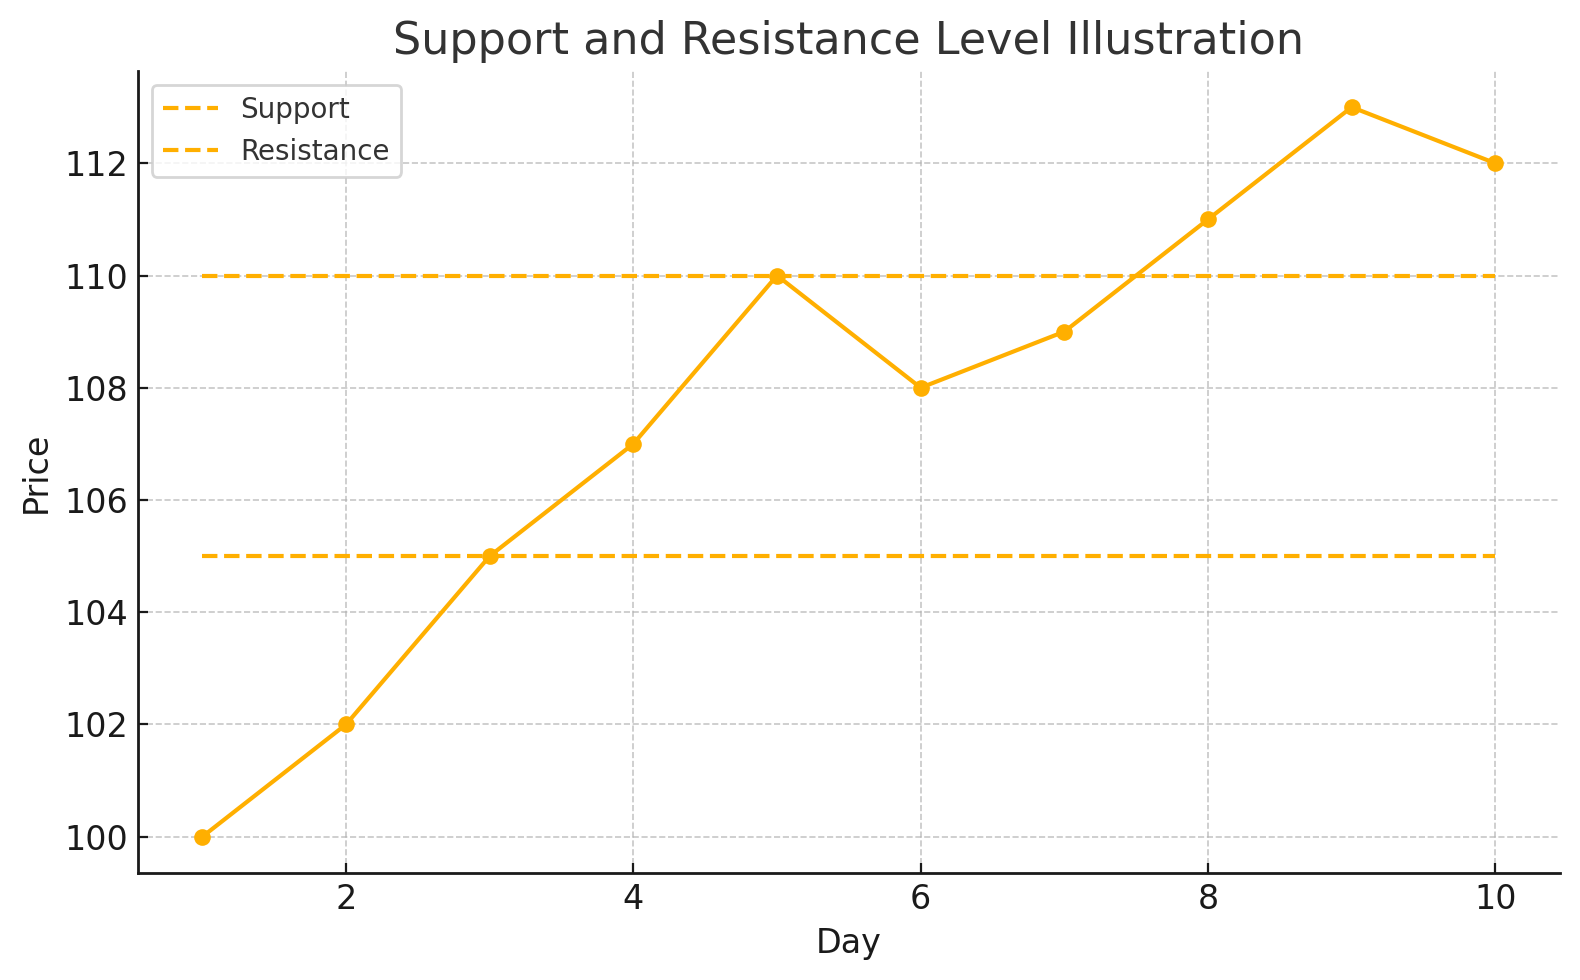
Traders should also try to identify support and resistance levels, as it can help them recognize price zones where buying and selling pressure historically intensifies. Support simple means a floor level that prevents further decline, while resistance acts as a ceiling capping gains. Prices usually bounce between these levels, helping traders see clear entry and exit points.
Volume is also integrated to help confirm price moves. Through volume analysis, traders are able to determine the strength of trends. A rising volume shows strong conviction, while a divergence between price and volume means that a potential reversal is about to happen.
In technical analysis, the time frame is also important. Short-term analysis (minutes to hours) provides quick chances but has more noise. Long-term analysis (daily to weekly) indicates bigger patterns and is more reliable. Technical analysis is a methodical way of looking at price, volume, and the way people think about the market.
For Example: The EUR/USD pair made a definite upward trend on the daily chart in early 2025, following an upward trendline. When the price went back to a previous support level at 1.0800, it rallied back rapidly on higher volume, which confirmed both trend theory and the rules for support and resistance. Traders that saw this setup went long and made money as the market went up.
Common Technical Indicators and Their Applications
A moving average helps sort out price data so that traders can easily identify trend directions. Simple moving averages (SMA) give equal weight to all periods, while exponential moving averages (EMA) emphasize recent prices. When the price crosses above the MA, it shows an uptrend signal.
The RSI indicator is another vital technical tool that helps to measure momentum on a scale of 0 - 100. When it shows readings above 70, it means there is an overbought condition in the market, while readings below 30 indicate oversold zones. The divergence between RSI and price can often hint at impending reversals.
MACD (Moving Average Convergence Divergence) is a method that uses two EMAs plus a signal line to find trend reversals more accurately. When the MACD line crosses above the signal line, it means that the market is bullish and may signal a buy.
Another important indicator is Bollinger Bands. It shows prices around a moving average with upper and lower bands established by standard deviations. A contraction means little volatility (a possible squeeze), whereas a price breaking out of the bands suggests high momentum.
Traders can also use Fibonacci retracement levels (23.6%, 38.2%, and 61.8%) to find support or resistance as prices pull back. Traders can use these levels along with trendlines to find a better entry point.
For Example 2: A 38.2% Fibonacci retracement level coincided with a trendline breakout, confirming a strong continuation setup.
Traders can figure out how the market feels by looking at candlestick patterns like the hammer, engulfing, and doji. For example, a bullish hammer at support with growing volume might assist traders in confirming a reversal.
Using both indicators and candlestick patterns together makes things more accurate. Always look at the market context behind indicator readings instead of just following the numbers.
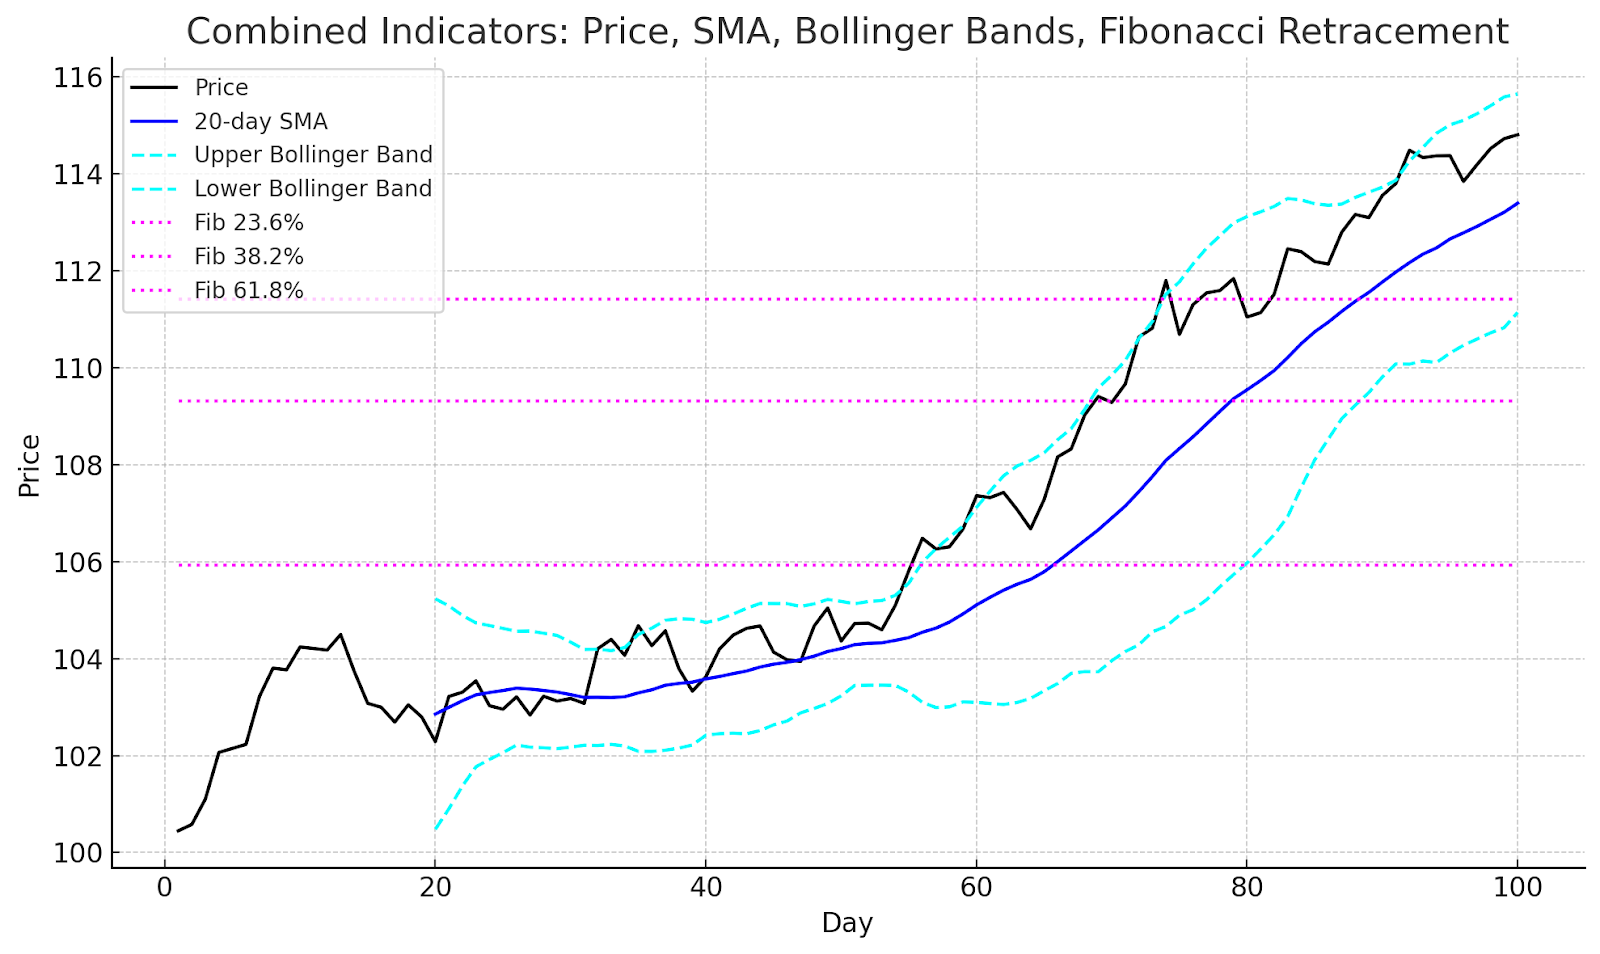
Chart Patterns: Trend Reversal Signals
Chart patterns give traders a way to see signals that a trend is about to change and setups that will keep going. Triangle patterns, such as ascending and descending triangles, can show a possible breakout and help traders make the right choices.
An ascending triangle means that prices will keep going up, while a descending triangle tells traders to be careful of prices going down. Flags and wedges also show that the current trend will stop for a brief time before continuing. A head and shoulders pattern is one type of reversal formation.
This pattern happens when the price breaks below the neckline, and the market goes from bullish to bearish. The double bottom pattern is another example of this kind of formulation. It shows that there can be an upturn when support is tested twice.
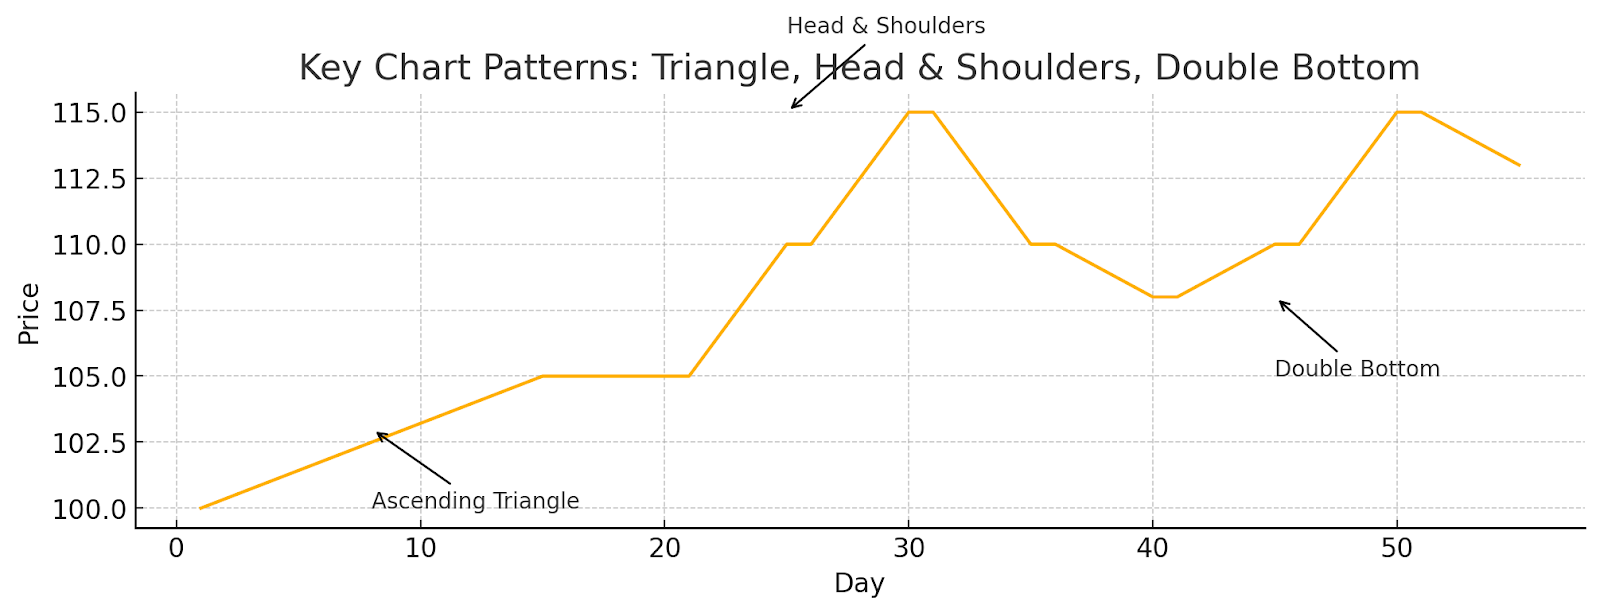
A rounded bottom shows that the mood is slowly shifting from sellers to buyers. Key recognition points are neckline placement and volume confirmation; for instance, a rising volume on a breakout validates the pattern. Most traders set a stop loss just beyond the invalidation point and take profit by measuring the pattern's height.
For Example: When both bottoms on EUR/GBP lined up at the same support level in 2024, a double bottom pattern started a successful reversal rebound.
Combining patterns with technical indicators like MACD divergence during a head and shoulders formation is known to boost confidence in the signal. Always confirm a pattern to reduce your trading risk and improve timing.
Risk Management and Trading Psychology
Effective risk management is the core of any trading strategy that will work. Before entering any trade, always set a stop loss strategy to limit your risk exposure and also set a take profit to lock in your gains. Also, make use of position sizing based on a fixed percentage, like 1 - 2% of your account on any single trade, to protect your capital.
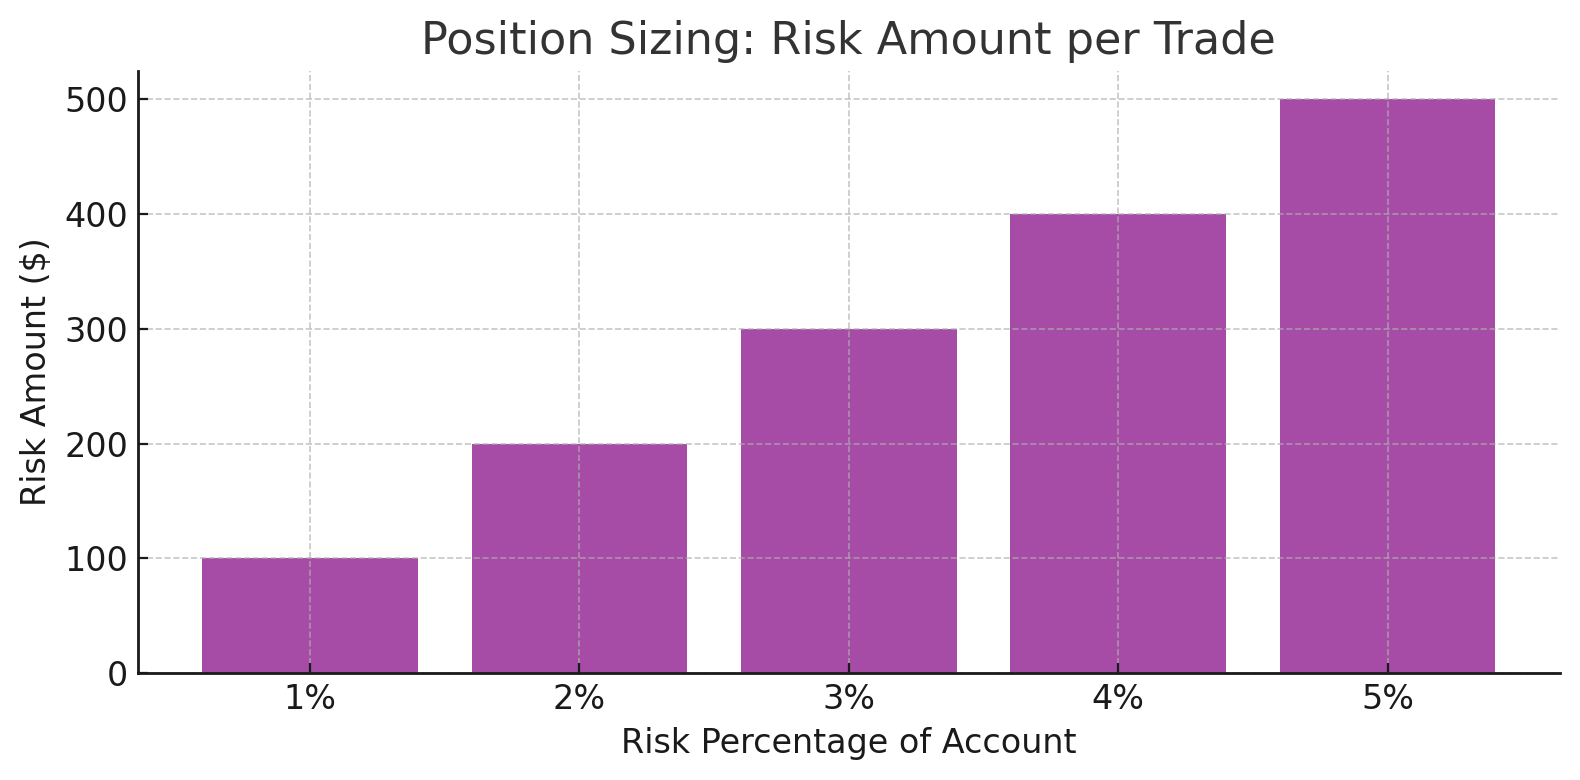
You have to maintain discipline and stick to your plan, irrespective of new breakouts and movements. Position sizing charts can help you visualize how much capital is best for you to allocate per trade relative to your defined risk.
Having a solid understanding of trading psychology plays a very important role in helping a trader become successful. This is because common pitfalls like fear, greed, and herd mentality can lead to avoidable losses. However, strictly following your trading strategy, setting appropriate stop-loss, and take-profits are steps that will help you avoid those pitfalls.
For Example: A trader who didn't place a stop loss on GBP/USD in early 2025 lost 5% of their money, which shows how important it is to have a strong stop loss technique.
Even if your charts are right, markets are unpredictable; therefore, you need to have good risk controls and mental discipline to make money over the long term.
Practical Tips and Trading Strategies Combinations
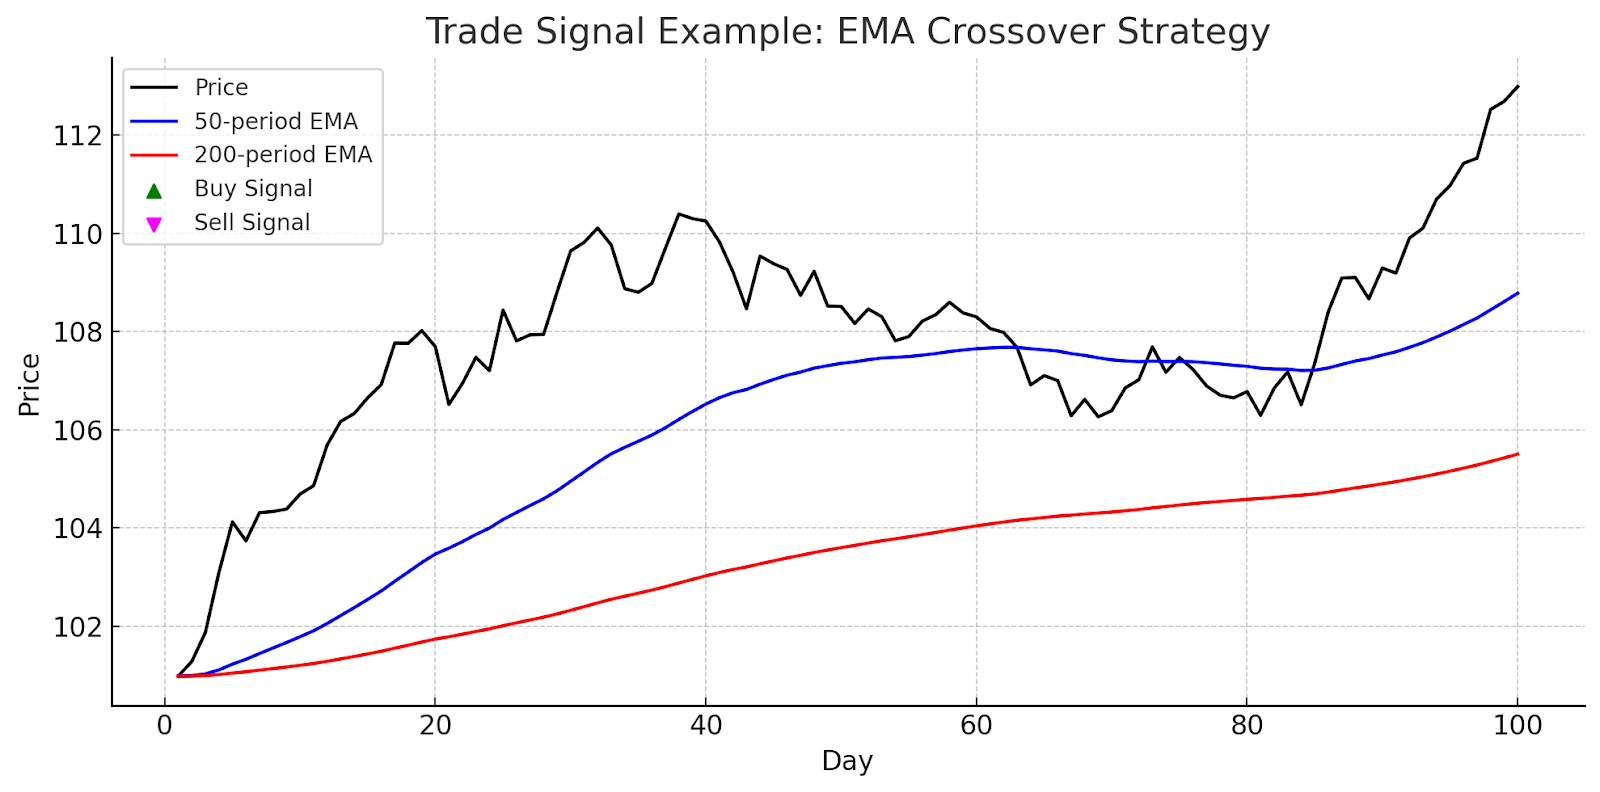
Building a solid trading system involves using trading strategies that fit your trading style and risk tolerance. A classic trend-following approach uses moving average crossovers, which enter long when the 50-period EMA crosses above the 200-period EMA and exit when it reverses.
Use the RSI indicator and Bollinger Bands together for range trading. When the RSI goes below 30, buy at the lower band; when it goes over 70, sell at the upper band. Breakout trading strategies look for price spikes that go beyond consolidation zones. To lower your risk, establish stop losses just inside the breakout level and confirm breakouts with higher volume.
For setups with a higher chance of success, use multi-timeframe analysis to line up a short-term signal on a 1-hour chart with the trend on a daily chart. Before you risk capital, you should always backtest and practice in demo trading on platforms like BtcDana. This helps you validate your system and fine-tune its settings.
To weed out false breakouts and optimize timing, think about combining important news, such as central bank pronouncements, with your technical signals. As market conditions change, you should regularly assess and change your plans.
Always backtest and practice in demo trading before risking real capital. This helps validate your system and refine parameters. Consider integrating key fundamental news—such as central bank announcements—with your technical signals to filter false breakouts and improve timing.
Example: A backtested method that included moving average crossings and RSI on GBP/USD made 12% a year over two years.
Frequently Asked Questions
Technical analysis looks at past price and volume data to find trends and make predictions about how currencies will move. Traders use indicators, trendlines, and chart patterns to figure out when to buy and sell in the forex market.
Moving averages, the RSI indicator, MACD, and Bollinger Bands are some of the most common instruments. Using more than one indicator, along with Fibonacci retracement levels and candlestick patterns, makes trend signals more accurate and reliable.
Very important. A good stop-loss technique, the right position size, and sticking to risk management guidelines will help you avoid big losses, keep your emotions in check, and make money over the long term.
Conclusion and Outlook
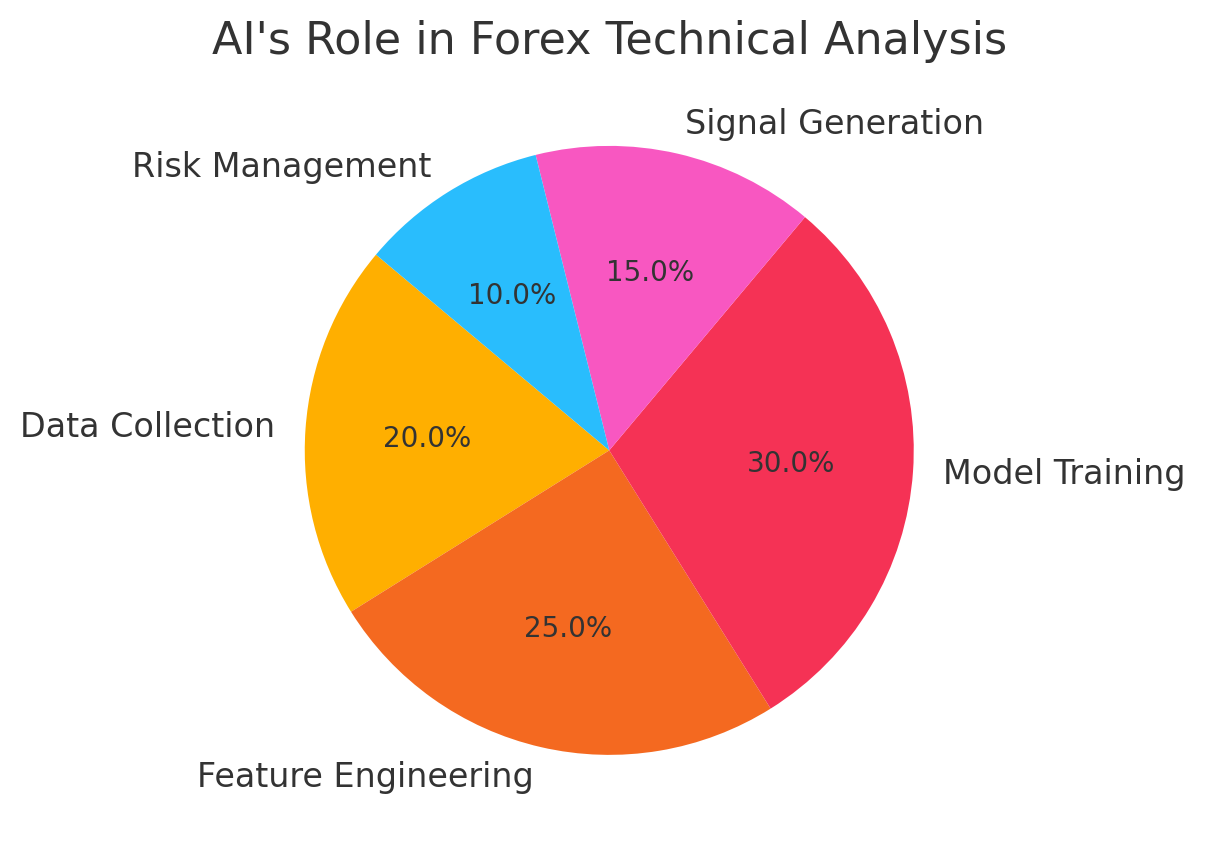
Technical analysis remains one of the most essential tools for traders of all levels, as it gives traders a systematic approach to interpreting price and volume data. AI trading and big data will change the future of forex technical analysis by making it easier to see patterns and get signals that are more accurate.
You need to keep learning and practicing: backtest your techniques, try things out in demo accounts, and keep up with the news. Check out our platform, BtcDana, for the best forex trading education. We offer a lot of videos, strategy manuals, and AI-powered analytical tools to get you started.
Are you ready to take your trading to the next level? Register now to get expert advice and the latest tools that will upgrade your trading skills.