


Far too often, markets do fall 'too much'- The concept of oversold
Have you ever seen a stock price tumble and thought that it had gone down too much? This is the idea of "oversold." When market prices decline rapidly in a short period and drop below reasonable or historical average levels, traders refer to this as an oversold condition.
Think of it like a rubber ball getting a good smack against a floor. The harder it hits, the higher it rebounds. The same idea applies with markets; although a rebound is not guaranteed.
Here is a professional example: when a stock's RSI (Relative Strength Index) starts to fall below 25, then you have an oversold condition. In March 2020, Bitcoin exhibited this condition perfectly with its RSI below 20, resulting in a tremendous rebound.
However, just because an asset is oversold does not guarantee a rebound. As mentioned, oversold is a technical signal that suggests the market will be in a correction period. It is not a crystal ball predicting the future market price movements. Successful traders use these signals but will do so as one of many variables.
Oversold 101: How to Tell When the Market has Gone Too Low
Definitions of oversold conditions vary, but to recognize oversold conditions, you need to understand when the market has moved down too much, and detached from its value or average movement. It may be helpful to think of the analogy of a brilliant student who studies hard and unlucky in their exams. They consistently score 64% on every exam! You know that student has more ability than that score suggests, so that student is undervalued in your mind.
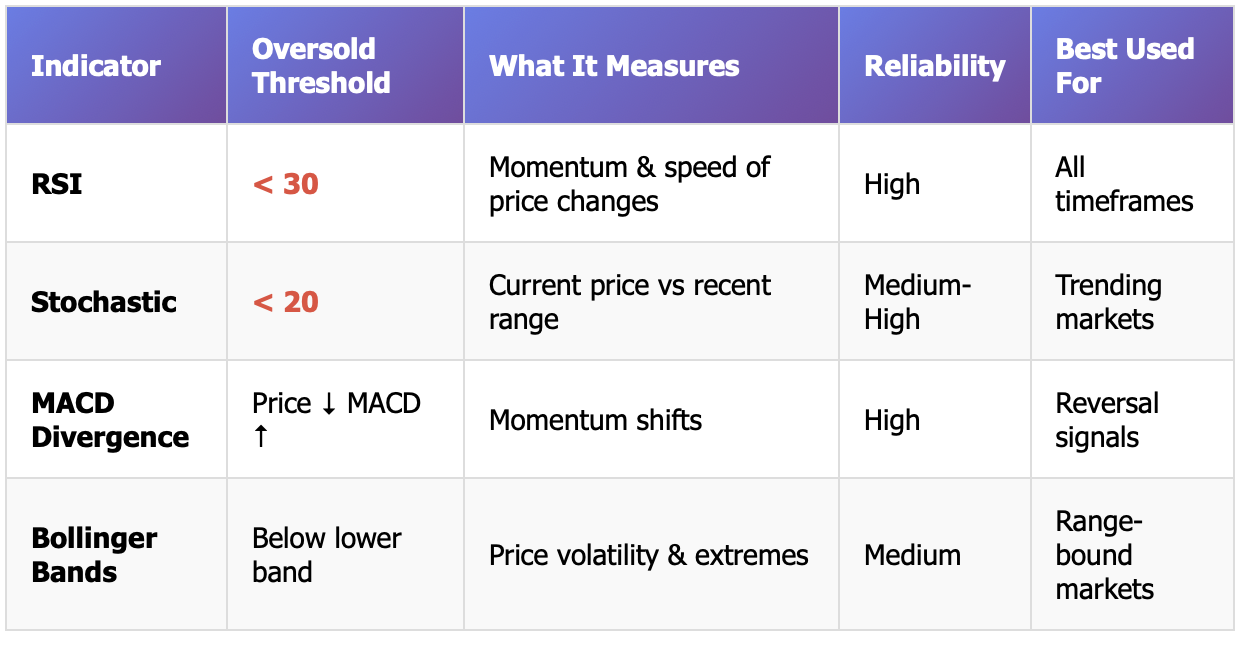
As traders, we can often identify oversold conditions with three reasonably accurate indicators.
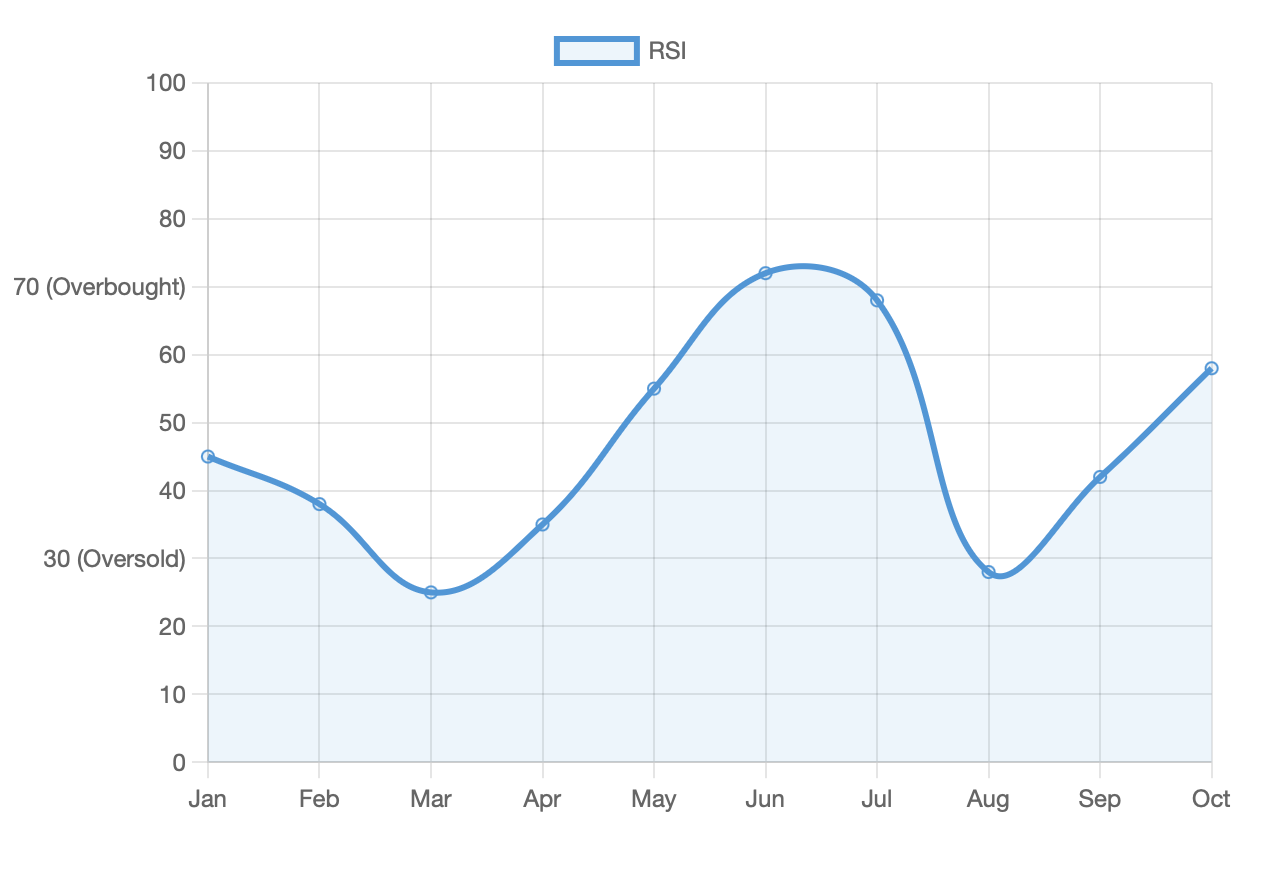
An RSI, relative strength index reading of less than 30. RSI measures how strong recent price movements are. When RSI moves beneath 30, we can reasonably conclude that selling pressure is more than normal.
A Stochastic Oscillator reading lower than 20. The stochastic oscillator compares closing price with the range of prices over a set period of time; prices lower than 20 indicate oversight territory;
A MACD Divergence - Lower prices the market keeps making, but the MACD indicator starts moving the other direction, indicating the market no longer has selling pressure.
On occasions, the price has risen too fast above reasonable measures, is identified also, called overbought; Meta stock in 2022 uniquely offered multiple examples. Meta stock, at times persisted diminishing for an extended time, and RSI read below 30, for example and Stochastic was close to zero for examples, during its major loss of value.
These conditions are, more or less, quantifiable measures of excessive pessimism. None may conclude specific reversals, however are useful measures to assess when market sentiment may have extreme bias one way.
The Bounce-Back Effect: Oversold Markets Never Stay Down Forever
Markets don't stay oversold forever. There are a number of good reasons that extreme selling behavior is often followed by a rebound. Understanding the mechanisms in play can help us spot potential buying opportunities.
Psychologically, humans are driven by emotion. During periods of extreme market stress or panic selling, investors tend to be confused and do not act rationally. However, panic selling does not last forever. Ultimately, the incapacity of panic selling will run its course, and buyers will begin to take a logical, rational approach to buying up bargains. The human experience is that when a grocery store places a product on sale at a deep discount, lots of shoppers rush in and quickly clear the store of the discounted product.
Technically, there are a number of factors that create natural buying pressure. When prices fall to oversold levels, several things happen simultaneously. People who are short sellers start to cover their positions. Value hounds who are willing to take a risk start to accumulate positions. And then automated trading algorithms may start executing buy orders. This mix of buying can create enough buying pressure to stabilize and possibly even reverse unrest and downward momentum.
Fundamental factors also exist. In many instances the actual or underlying value of a company or asset class has not declined as sharply as the price reflects. Market overreactions create situations where price and value are out of synch and eventually this separation usually resolves itself over time.
An excellent example of this is the 2020 U.S. stock market. Circuit breakers were triggered a number of times as panic selling went into a frenzy. Once buyers got over the initial shock, they saw that many companies were trading way below their fair value, which fueled one of the biggest recoveries in market history.
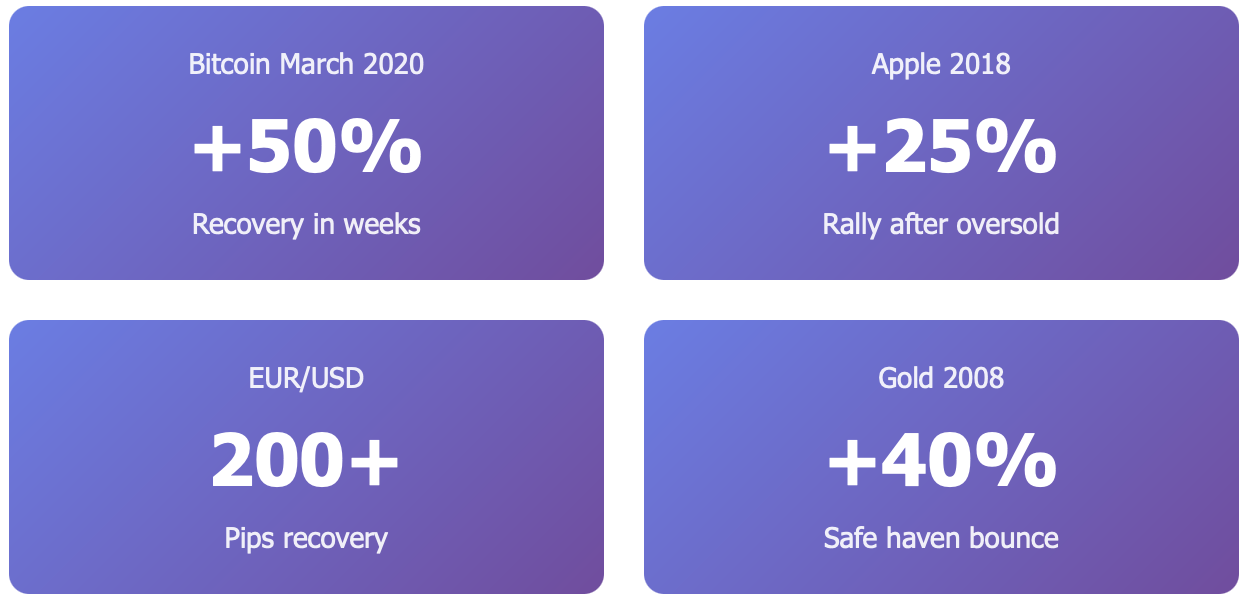
Similar behavior occurred with gold during the 2008 financial crisis. Gold's RSI went into oversold territory as everything was sold without consideration, but it immediately bounced back as more compelled investment rushed into a safe haven asset.
The VIX (fear index) will often spike during oversold conditions, and this is typically followed by a fall as fear begins to abate and markets stabilize. This inverse relationship between extreme fear and rebounds has happened over and over throughout history.
Remember that rebounds are neither certain nor immediate. The markets can stay irrational longer than you anticipate, however oversold conditions heighten the probability of any eventual upside.
Recognizing Oversold Signals: The Know-How of Tools that Traders Use
Learning how to recognize oversold conditions involves the use of several indicators that can be used simultaneously. Each indicator provides a different insight to market momentum and market sentiment.
The RSI (Relative Strength Index) is likely the most used oversold indicator. RSI measures the velocity and magnitude of price movements ranging from 0-100. Anything below 30 usually means the stock is oversold. Think of RSI in terms of how tired a runner gets as the race goes on-if RSI is below 30, then the runner, or stock, is hitting a temporary low and the runner, or stock, needs to recover.
For example, towards the end of 2018, Apple stock had an RSI below 25 before rallying significantly after its oversold condition. RSI indicated to us when there was excessive selling pressure.
Stochastic Oscillator takes a slightly different approach in determining if the stock is oversold. The Stochastic Oscillator compares the current closing price in relation to the price range over a specified number of periods. Readings below 20 indicate an oversold condition. Stochastics can also provide good entries and exits in a trending market.
MACD divergence is still another way to evaluate an oversold condition. When the price keeps making lower lows and the MACD line points to higher highs or higher lows this suggests the downward momentum of the stock is fading or weakening. Divergence typically happens before reversals and can give you a heads up on a potential change.
.Bollinger Bands identify dynamic support and resistance based on price volatility. If price action breaks below either band, and you have high volume this could potentially indicate an oversold situation. The EUR/USD currency pair has made this move multiple times and bounced back after the RSI dropped below 30. Forex traders often take these as really good buy signals and use them to time their entries in major currency trends.
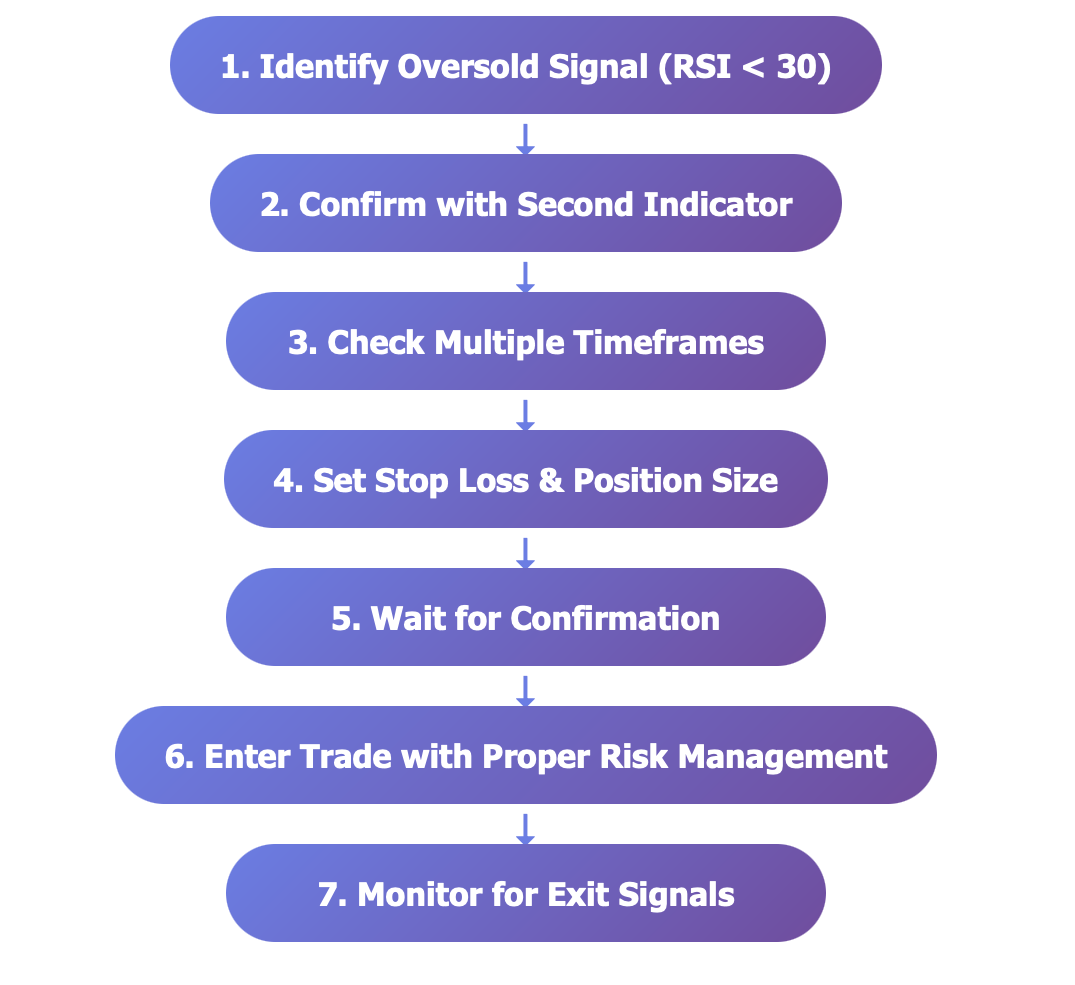
Professional traders in general don't put much faith in any one indicator and they generally will have multiple signals to give them confidence and provide confirmation to reduce the chances of false alarms. When a stock has an RSI below 30, Stochastic below 20, and MACD divergence, they are more likely to accept it is oversold than just a single indicator.
Timeframe also matters. A stock might be oversold on the daily chart but still be trending down on the weekly chart so it's always warranted to look into larger timeframes when considering these indications.
Trading Oversold Like a Pro: Big Opportunities, Even Bigger Risks
While oversold indicators can create interesting trading opportunities, there can also be risks that could potentially be much larger and need to be managed.
The way to apply oversold conditions depend on the trading style or the objective of the trader.
For example, for a technical RE trader, buying when RSI hits below 30 may yield good results in range bound markets. However, the trick is waiting for confirmation: either the RSI starts to turn upwards or the price action shows signs of a return to stability.
CFD traders use oversold conditions mainly to capture quick rebound moves. CFDs allow you to capture short and aggressive price movements without owning the physical instrument. But it can also amplify your gains and losses.
For long term investors, oversold conditions can provide opportunities to acquire quality stocks at lower prices. The famous quote by Warren Buffett to be greedy when others are fearful is a common way position long term buying in oversold conditions.
Unfortunately, that is where reality can get messy. There are a ton of risks involved; you can't ignore risks that are possibly significant.
There is the falling knife problem; oversold conditions can last for longer than one expects. The fall in crude oil prices in 2014 is probably a sobering example: for months, the RSI was below 30 as crude oil prices went from over $100 per barrel to under $30.
False indicators also happen frequently. Just because something looks oversold does not necessarily mean it is not going to get even more oversold. As the saying goes, they may be irrational longer than you may be solvent.
This is another good reason for you to have stop-loss strategies whenever you are trading oversold signals. Have ready set exit points before you enter your trades and stick to them even if it seems that the bounce is so obvious.
Also, position size is important. Even if I believe that the oversold signal is good never risk more than you can afford to lose on one trade. The market really doesn't care about you or your analysis and especially your money!
The 2022 Bitcoin drop below $20,000 reiterated a lot of these lessons for many traders. There were clear oversold readings on the RSI but the bounce still took months to materialize. Trades that either jumped in too early or too much capital on the trade saw drawdowns.
Think of your oversold signals like the weather forecast, sunshine after several rainy days, it could be right but may rain again after all. As always, carry an umbrella (stop loss) just in case.
From Bitcoin to Tesla: Real-Life Oversold Stories You Can Learn From
Real world examples bring oversold concepts into focus and demonstrate how these signals unfold in a variety of markets and timeframes.
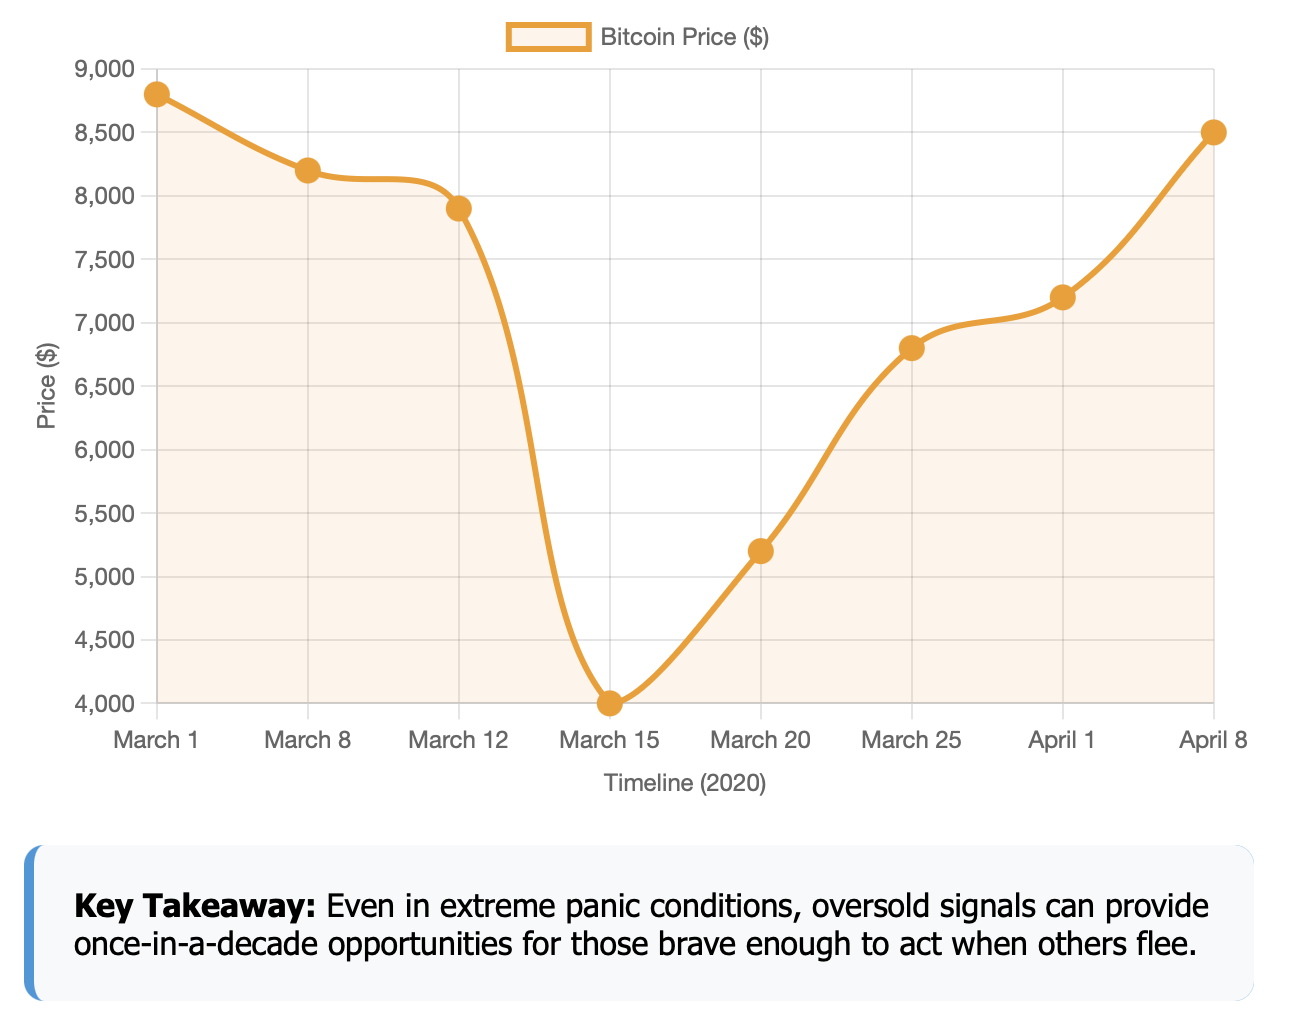
Bitcoin's March 2020 Crash stands out as perhaps the most outrageous oversold instance recent memory. As world markets panicked due to COVID-19, Bitcoin's RSI fell to approximately 20 - deep into oversold territory. The currency tumbled from almost $9,000 to below $4,000 in a matter of days. But for those who recognized the oversold signal and bought near the bottom, the reward was significant, as Bitcoin rebounded over 50% within a few weeks, ultimately making new all-time highs above $60,000.
What can we take away from that experience? Recognizing the signal of oversold conditions can present once-in-a-decade opportunities even in the height of panic - for those willing to step while others run.
The EUR/USD Forex Example demonstrates currency markets intensifying oversold signals. During various episodes of U.S. dollar strength, there have been repeated moments where the EUR/USD pair will show RSI readings around 25, and then subsequently derivations of 200+ pips. Currency traders who learned to trade oversold signals could often monetize the signal.
Forex markets are generally not as volatile as crypto or individual stocks, so oversold signals will be somewhat more reliable. The high level of liquidity also means that when they do reverse, they can be fast and substantial.
Tesla in 2022 provides a cautionary tale about being patient and timing trades. The stock's RSI dipped below 30 multiple times during the decline from over $400 to below $150. Those eager to act on the oversold signals faced an additional few months of losses before the stock experienced any signs of meaningful recovery.
This example serves as proof that oversold conditions in single stocks may last longer than broadly oversold situations in the entire market. Company-specific issues, changing fundamentals, and evolving sentiment can delay the effectiveness of technical signals for extended periods of time.
The lesson learned from the Tesla example is that "oversold" does not mean "buy right now," it means "pay attention and get ready for a potential opportunity." Intelligent traders waited for subsequent signals of confirmation before putting significant money to work.
These examples illustrate that the definition of oversold signals works across multiple asset classes and market environments, it also shows that timing and risk are critical. The best way to understand this is when the proverbial rubber band gets stretched too much in one direction, the snap-back can be significant, but knowing precisely when it will happen takes skill and patience.
Every market has its characteristics. Crypto generally swings harder and recovers faster than Forex, and stocks can have company specific news that overrun technical signals.
However, what is consistent in all successful oversold trades is that traders combine technical analysis with proper risk management, while being realistic about timing.
Oversold is a signal not a commitment: Here is how to use it safely
If you know what an oversold reading means, it can provide you with a unique advantage for interpreting market sentiment and locating potential opportunities - but don't forget that an oversold signal is a signal of what has already happened, not what is guaranteed to happen next.
The most successful traders use multiple indications in combination, and never depend too much on any one signal alone. They are also using proper risk management, which includes stop losses and position sizing to protect themselves when the signals do not materialize as expected.
Ultimately, they have realistic expectations. Oversold signals provide insights for determining when markets might be ready for a bounce, but they do not provide the exact timing or strength of that bounce. Whether one is day trading short-term rebounds or looking for long-term value opportunities, oversold analysis should be only one component of a larger market strategy.
Want to put oversold signals to use in your trading? Start practicing in demo accounts risk-free and build your skills before allocating real capital.
Join thousands of traders at BTCDana.com and learn everything there is to know about technical analysis with a full suite of educational tools and getting started with our advanced trading platform.