


Introduction: Understanding How to Trade Gold in Today's Market
Although gold is a shiny metal, it also carries many definitions for people around the world. In addition to representing a globally accepted form of value and a hedge against uncertain economic conditions, gold has been actively traded around the world and is considered one of the most heavily traded commodities in the financial market. Investors often use gold as a safety net during periods of economic and currency volatility.
However, understanding how to trade gold profitably requires more than just buying gold low and selling it high. There are many different factors that will drive gold's movement, including the strength of the USD index (DXY), real interest rates, geopolitical tensions, and technical chart patterns. Therefore, if you do not consider these variables, you are essentially trading gold blind.
For example, in 2022, as the Federal Reserve raised interest rates aggressively and the dollar surged to its highest level (20-year highs), the price of gold decreased significantly. In fact, some professional traders were capable of understanding this inverse relationship, who could predict where the price would head and position themselves accordingly. For new traders, think of gold as a collectable item on a global scale; when the USD is strong, gold is more expensive for everyone else in the world, resulting in reduced demand for gold and ultimately decreasing the price of gold.
How the US Dollar Index (DXY) Drives Gold Prices
The strength of the US dollar is represented by the DXY, which is a weighted index that compares it to six other currencies: the Euro, Japanese Yen, and British Pound.
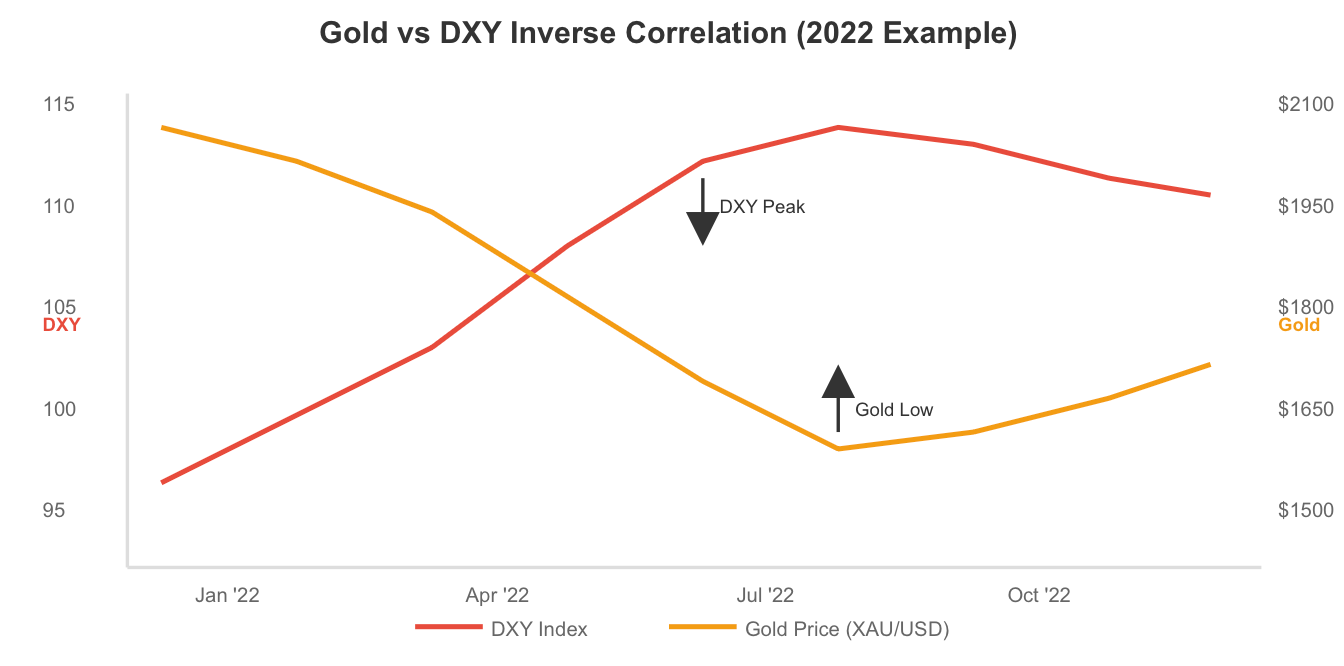
The DXY is one of the best ways for new traders to see the relationship between gold and the US dollar, as they have an inverse correlation with each other. The higher the DXY goes, the lower the price of gold tends to fall. The lower the DXY goes, the higher the price of gold tends to increase.
The relationship between gold and the dollar exists due to the fact that gold is priced in US dollars. Therefore, when the dollar becomes stronger (higher DXY value), then gold prices will appear higher for those who buy gold with currencies other than the dollar. Conversely, when the dollar is weaker (lower DXY value), gold prices appear lower and more attractive to buyers using non-dollar currencies, creating higher demand.
An example of the negative correlation between gold and the dollar is the DXY's impressive growth during 2022, coinciding with the increase in Fed interest rates to address inflation. The DXY index increased from around 95 to 114, and in contrast, the price of gold decreased from approximately $2,070 per ounce to below $1,650 during the same period. Any trader who had an understanding of the DXY and how its value affects gold prices would have made money based on these trends by either avoiding trading or shorting gold during that time period.
If you think of a dollar as an inch long stick, for gold to measure up to that stick (the "stick" of the dollar), it is going to take more sticks to measure one ounce of gold when the stick is increasing in size, whereas if the stick was to decrease in size it would take less inches (less sticks) to measure one ounce of gold.
When you are learning how to trade gold, the first thing you should do is check the DXY to see where it is headed before you place an order to buy or sell XAU/USD. Is the DXY moving up, down, or is it showing signs of reversing? The chances are that if the DXY is rising, the probability is that gold would trade lower than it did yesterday, and on the other hand, if the DXY is falling, the DXY may suggest gold might have a good chance to trade higher than it had traded prior.
Traders who are smart look at the DXY as a primary indicator of the trend of gold, so before entering a trade in gold, examine where the DXY is moving to understand where gold may move in the near future.
In summary, you cannot trade gold without knowing what is happening with the dollar, as the DXY is one of the key indicators that you should look at when deciding whether to enter or exit a position in gold.
Real Interest Rates and Their Impact on Gold Trading
Knowing the significance of Real Interest Rates is one of the most essential components to consider when trying to trade Gold. Real interest rates are the difference between nominal interest rates and the rate of inflation. For example, if you own a 10-year Treasury Bond that yields 4% and there is an inflation rate of 2%, your Real yield is only 2%. Why is this important to Gold? Gold does not pay a yield or dividend.
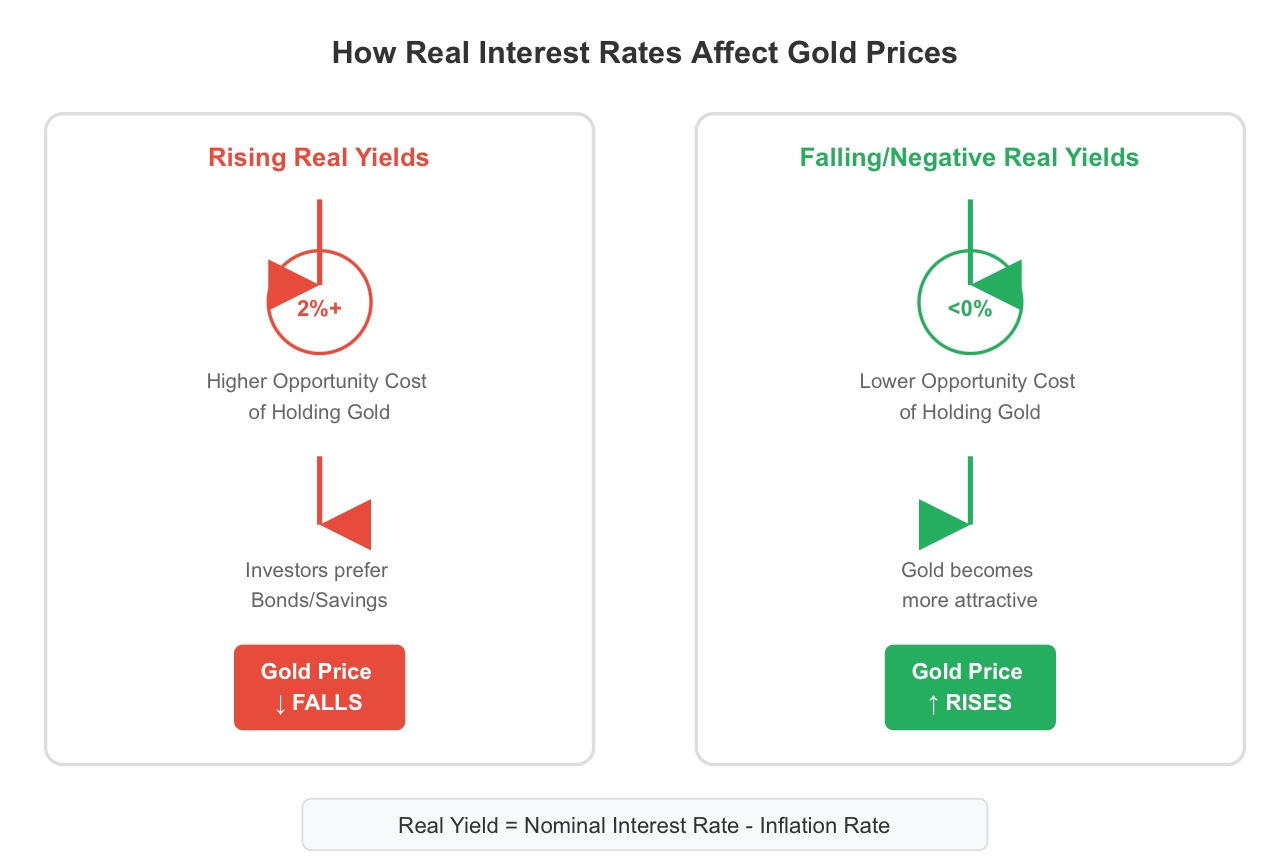
When Real Interest Rates increase, it represents an increase in the opportunity cost of holding Gold; therefore, Investors will be able to earn a greater return by either investing in Bonds or in a Savings account. As a result, the demand for Gold decreases and ultimately leads to lower Gold Prices. On the opposite side of this are negative Real Interest Rates, or when Real Interest Rates are declining or negative; during these times, Gold becomes more attractive as the opportunity cost of holding it decreases, making it a more favourable investment.
In 2023, the Federal Reserve, in response to the declining inflation due to the economy recovering from COVID-19, continued to raise interest rates. In response to that and due to the rise in the rate of inflation, the Real Yield on 10-Year Treasury Bonds surged above 2% and, as a result, created serious headwinds for the Gold Price, resulting in short-term declines. The professional traders who tracked Real Yields were able to anticipate this situation and adjust their holdings accordingly.
If you're just starting to learn how to trade gold, one important thing to keep in mind is that rising real yields typically indicate tougher times ahead for gold prices, while falling or negative yields create an opportunity for the price of gold to appreciate.
In general, rising real yields imply higher interest rates than what most people will sell their gold for. Thus, if you plan on holding gold as a store of wealth for a long period of time due to potential instability, you will probably want to continue to monitor US 10-year real yields regularly, just like you do when trading other commodities and, for that matter, any investment.
By tracking US 10-year real yields regularly, you can align your trades with the real yield trend, which will help maximise your returns and reduce risk.
Generally, it’s best to stay out of long positions in gold when the current yield curve is rising and exhibiting no signs of reversing. In contrast, it's wise to consider going long in gold while the yield curve is declining, especially in anticipation of future interest rate increases or while the yield curve is declining and exhibiting significant levels of inflation.
Geopolitical Risks and Gold as a Safe-Haven
Geopolitical occurrences are the primary catalysts behind many of the biggest fluctuations in gold pricing. Geopolitical instability, including wars, trade conflicts, and sanctions, has not only caused investors to shift their money into gold due to its position as a safe-haven asset but also led to dramatic changes in the price of the commodity.
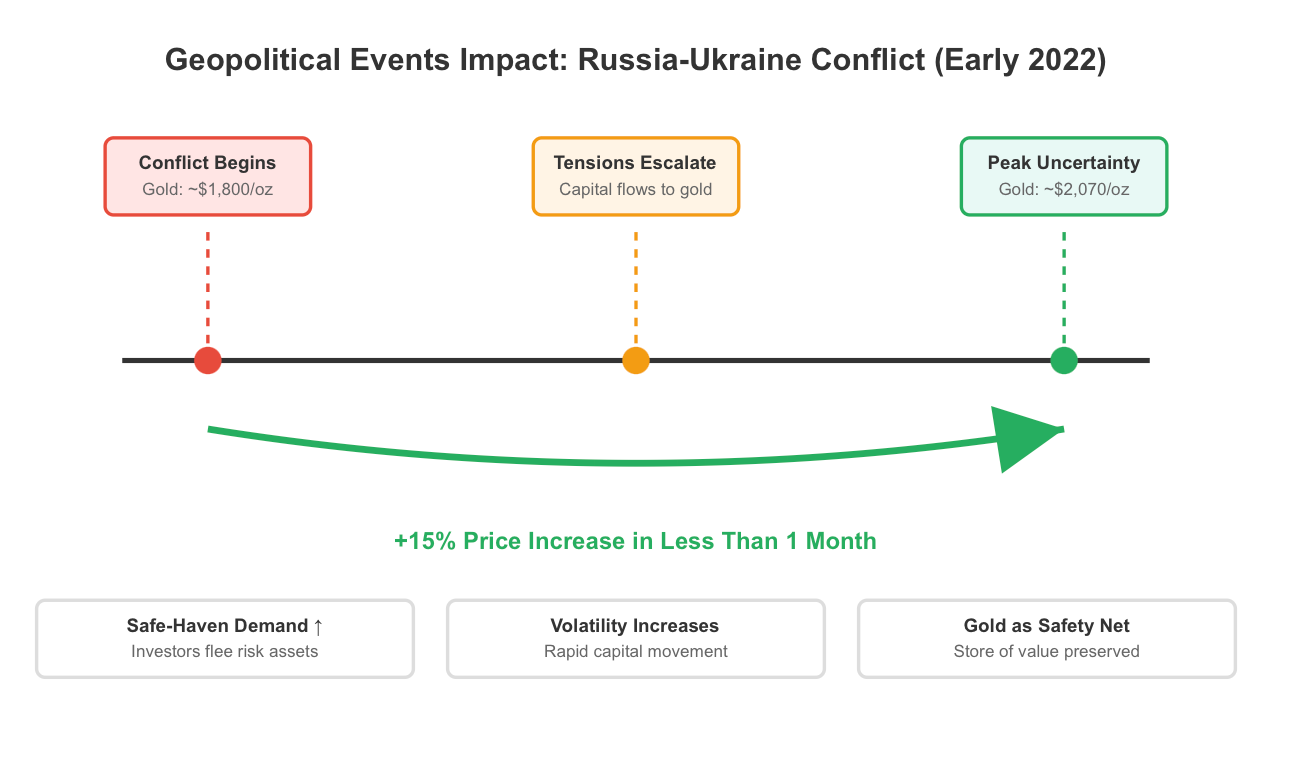
Historically, gold has always been viewed as a safe storage option during times of uncertainty. Investors who are concerned about geopolitical events often invest their respective funds into gold instead of riskier financial instruments such as stocks or currency. As gold becomes more appealing, greater amounts of capital are moving into gold. The result is a sudden increase in the price of gold because of the accompanying rush to find safety by many investors. Traders who are able to identify this risk early on can easily take advantage of these price swings.
The conflict between Russia and Ukraine in early 2022 shows this very well. The conflict was still unfolding, and as geopolitical tensions grew greater, capital moved rapidly from riskier investments, such as stocks and currencies, into the safety of gold. Therefore, in less than a month, the price of gold rose from approximately $1,800 to approximately $2,070 per ounce. Traders who recognised the risk that was present with the situation, and positioned themselves as long positions with gold, made a lot of money on this price movement.
For people just starting to trade gold, you can think about gold as your financial safety net. Whenever geopolitical instability exists, such as when there are military conflicts, economic sanctions, or when there is a lot of political chaos, people want to protect their wealth. Therefore, they look to gold, as it has always been viewed as a trusted source of value for thousands of years.
As you learn how to trade gold, monitor world events regularly. Major world events can sometimes have a more immediate impact on the market than technical/fundamental analysis. Escalating conflict between two nations or regions, and as a result, the price of gold may be supported by increased investor interest due to uncertainty about the future/market in those areas. In contrast, decreasing conflict and uncertainty will often cause a quick and significant drop in the price of gold.
Using geopolitical events to assist in forming a trading strategy: For example, if you presently hold a long position on gold and there is a resolution to the conflict where you believe that gold will not go back to new highs, you may want to take your profit and exit your position. If you are not currently involved with gold and see a significant event occur, consider buying gold quickly at a long position. As always, remember that price movement due to geopolitics can be quite volatile and very uncertain, and therefore, a very disciplined approach to risk management should be followed.
Technical Analysis: Support, Resistance, and Entry Points
Macroeconomic factors provide insight into the reasons behind fluctuations in the price of gold, while technical analysis shows us the best times to enter and exit our trades. Becoming proficient in technical analysis is essential to profiting from trading gold.
To get started, you should learn about the most basic forms of technical analysis: trend lines, support levels, resistance levels, and moving averages. Using trend lines allows traders to identify the overall direction of the market. A support level is a point at which the price of gold has stopped moving down and started back up (i.e. the price is supported). On the other hand, a resistance level is a price point where the price of gold has difficulty breaking out and therefore becomes the highest, or "ceiling," price.
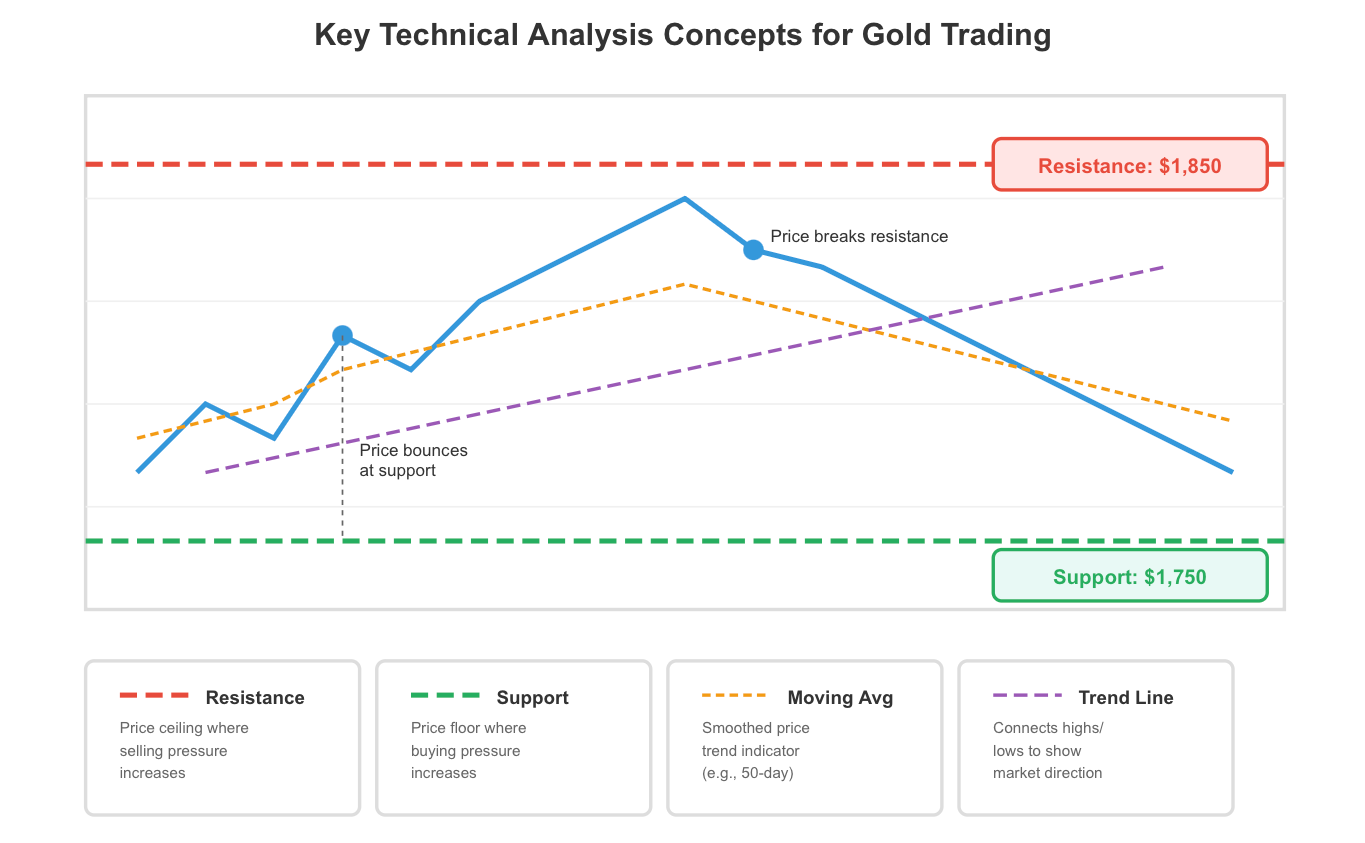
The moving averages (like a 50-day or 200-day average) provide a smoothed representation of price movements and help traders determine whether or not gold is currently moving in an upward or downward direction. Gold trading above its moving average indicates a bullish signal, while below indicates a bearish sentiment.
Chart patterns also play an important role in a trader's decision-making process. For example, triangles (ascending, descending, and symmetrical) generally signal that a market is in the process of consolidating before making an upward breakout. A double bottom (often referred to as W patterns) suggests a change in the direction of the market's price, moving from bearish to bullish. Head and shoulder formations are used to predict where a price's upward movement will run out of steam and cause the price to reverse.
An excellent example is XAU/USD, where in late 2021, several times, the $1750 area provided significant support. This support area repeatedly attracted buyers each time the price came down to this area. Traders who observed these patterns could buy around $1750 and place very tight stop-losses just below this level and target resistance areas $1830 - $1850.
Support can be analogous to the floor of a room holding a stable ball. In this analogy, every time the ball touches the floor is a measure of reliability that the floor will continue to support. So, if the ball were to break the floor, it would represent an indication of a change (a break of support), and this often leads to even greater downside movement.
When learning how to trade gold, remember that you should never base any of your decisions solely on technical analysis; you should always use the macroeconomic factors and influences we discussed before (DXY, Real Yields, Geopolitical Issues) for confirmation before executing trades.
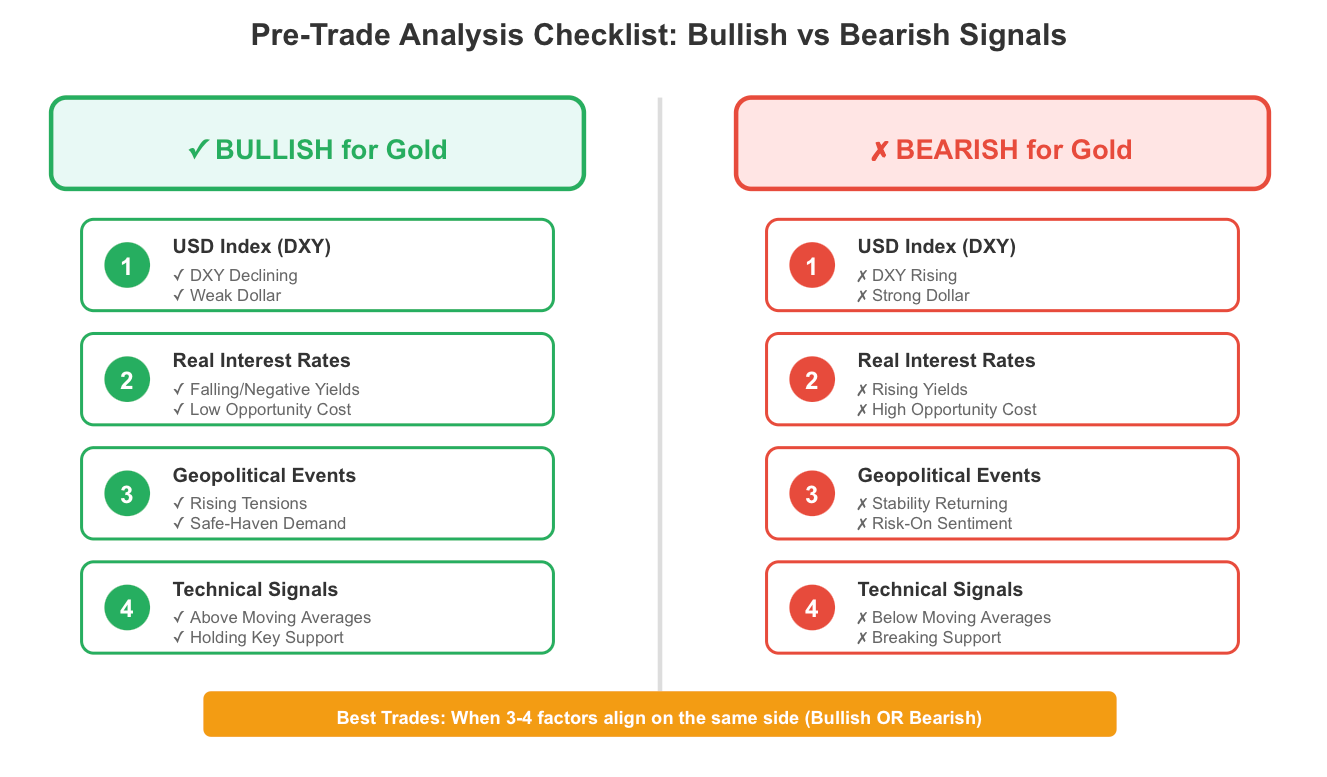
For instance, if, through technical analysis, you observe a bullish scenario for gold through an indicator, but at the same time, DXY is increasing in value along with an increase in Real Yields, your strategy is to be cautious. The ideal trades to execute will involve the agreement of two or more factors corresponding to that trade.
Using technical levels will pinpoint the exact points at which you enter/exit the market, thus converting your wide-angle market views to actionable trades with clear risk levels.
How to Trade Gold
Now, let's put everything together into a practical, step-by-step approach for trading gold effectively.
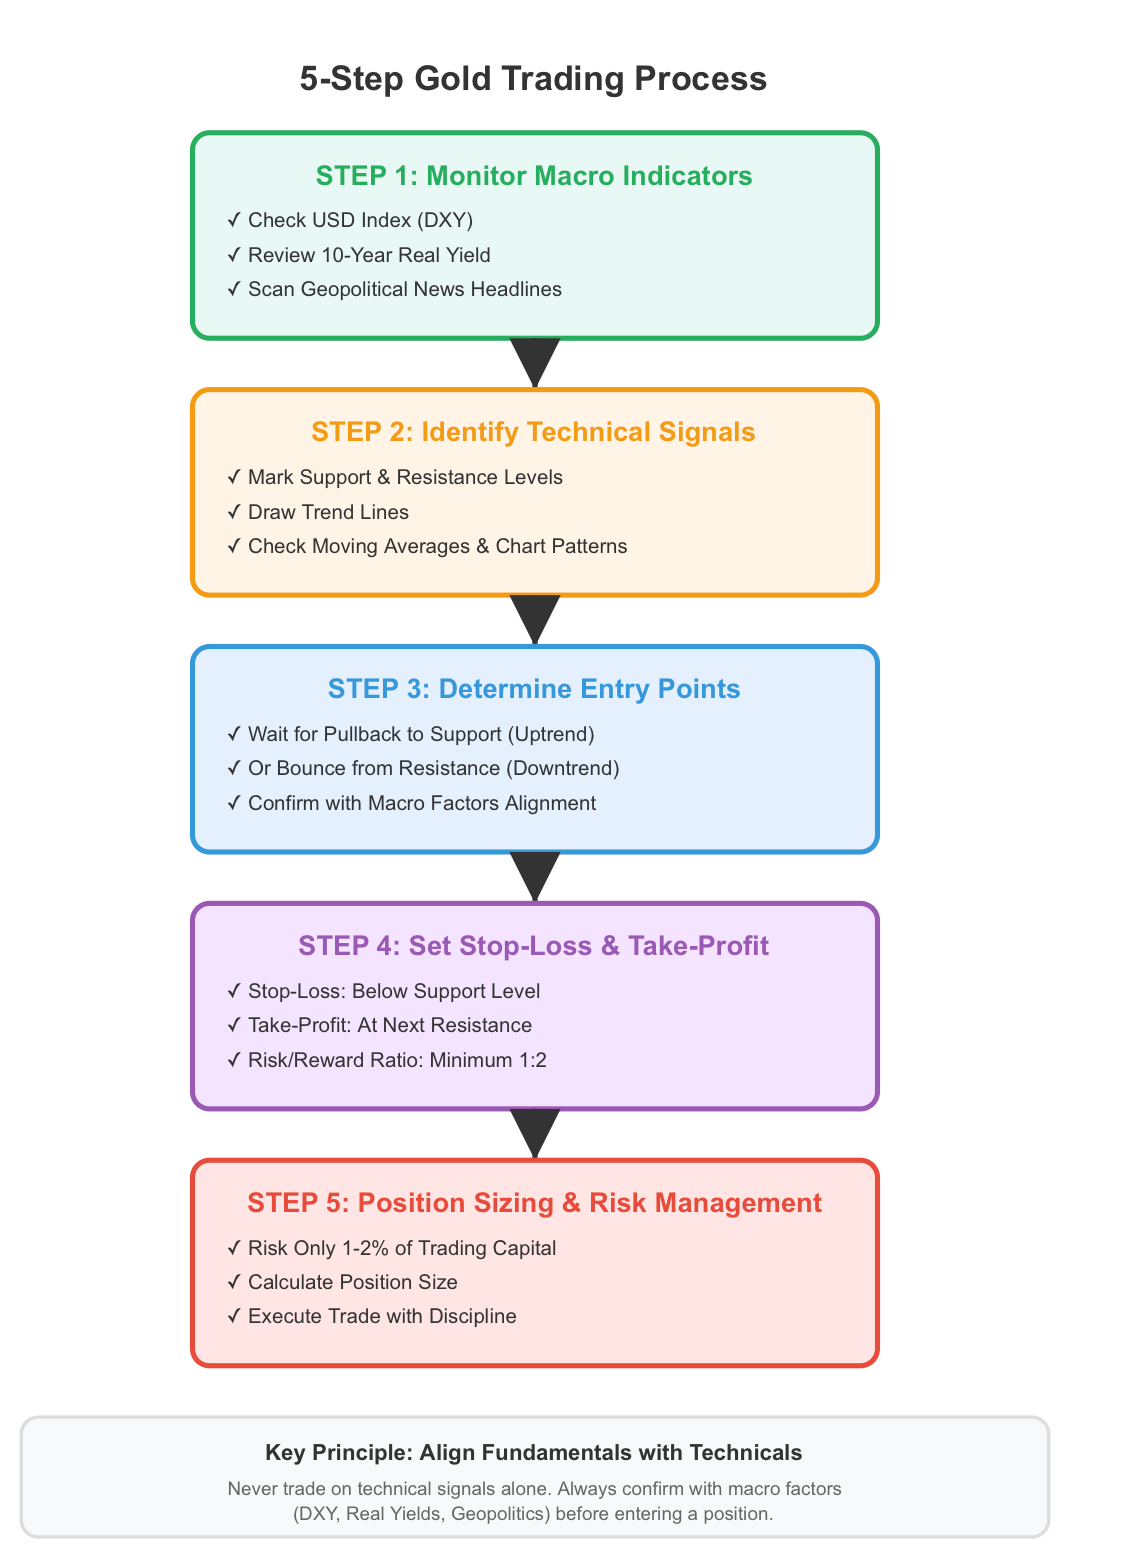
Step 1: Monitor Macro Indicators
To begin your trading day, check the USD Index (DXY), 10-Year Real Yield and Major News Headlines regarding Geopolitical Developments to determine whether these items will be Bullish or Bearish for Gold. If the DXY has increased dramatically and the Real Yields have also increased, expect gold to encounter headwinds. However, if the Dollar is declining and Geopolitical Tensions are continuing to escalate, Gold may have the opportunity to make significant moves upward.
Step 2: Identify Technical Signals
To identify technical signals on an XAU/USD chart, identify and mark key support and resistance areas, draw trend-lines, and determine where current price action is relative to significant moving averages. Additionally, consider identifying chart patterns indicating possible breakout or reversal strategies. Is gold currently respecting key support? Has it broken through the downward trend line established in the previous period?
Step 3: Determine Entry Points
Your best entry point on a trade is often at the time of a pullback to key support while in an upward trend or a bounce from resistance when in a downward trend. For example, if gold is moving up and then pulls back to the 50-day moving average while the DXY is moving lower, that would indicate a possible buy signal. Conversely, you may consider the entry for a breakout as appropriate should gold break through a critical resistance level, pursuant to significant volume.
Step 4: Set Stop-Loss and Take-Profit Levels
For every trade, investors must define their risk. Your stop-loss should be positioned just below the technical level that is being used as the basis of entry into the trade. For example, if purchasing at support around the $1,900, suppliers would put their stops at a price point just below this, possibly around $1,880. The price target for a take profit would typically be placed at the next resistance level, which could vary between $1,950 and $2,000 depending on market conditions or other technical indicators.
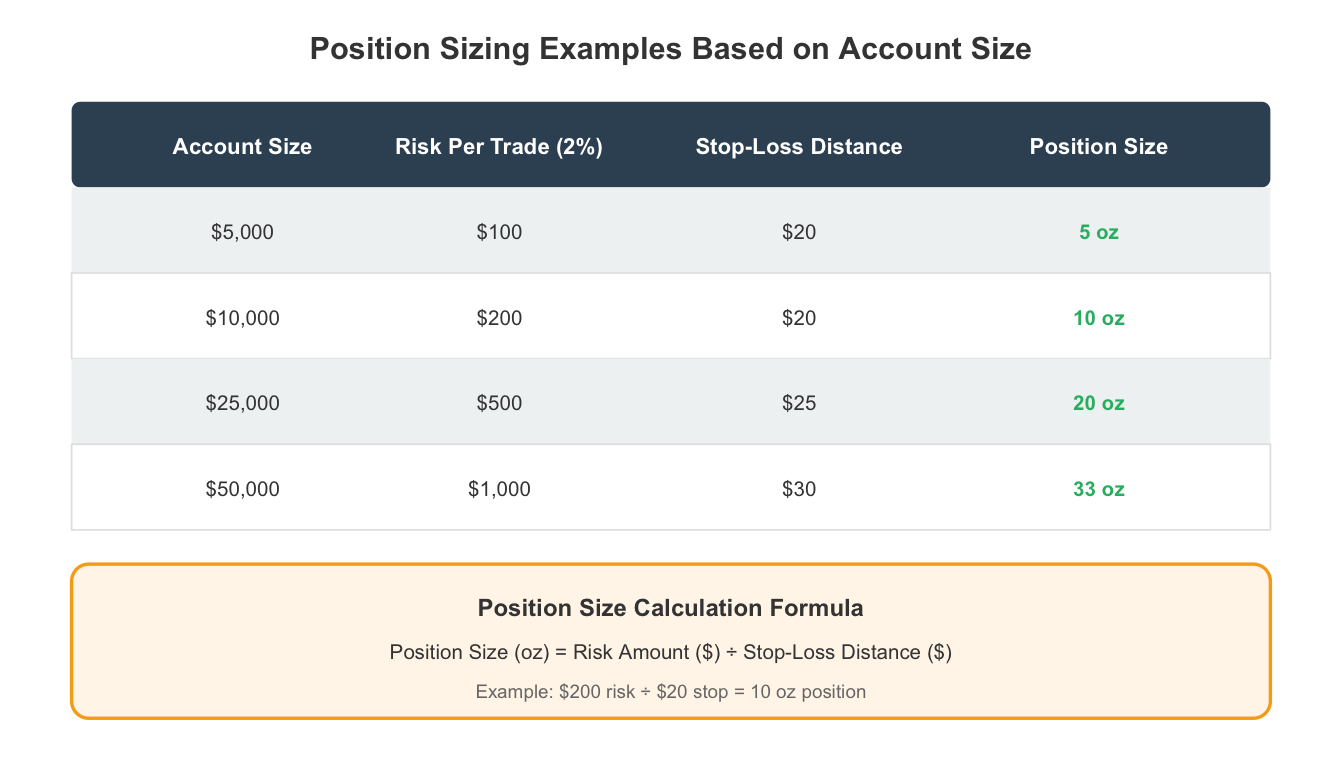
Step 5: Position sizing and risk management.
When trading, you should never risk more than 1% to 2% total of your trading capital on an individual trade. For example, if you had a $10,000 account and were risking 2%, your total loss would be limited to $200 on that trade. In order to determine your position size, you will need to calculate based on the distance between the stop loss you placed and the price point your entry was made, using that stop loss as a reference point.
An example of a professional would be during the summer of 2022, when the DXY had peaked close to 114, while also showing signs that DXY was entering into a decline, while at the same time, gold had found support near $1,680. Therefore, a trader who uses technical analysis and follows the trend may have taken a long position in anticipation of potential dollar weakness by utilising the fundamentals/current events surrounding it as their rationale. An example of this would have been placing the stop-loss order at $1,650 and setting stop/sell targets at $1,750 and $1,830.
As a novice trader, consider the process of making purchases in order to build a collection, not one large purchase. When trading, do not commit to spending your entire budget at one time. Instead, buy a small amount of product (ie, shares) and see how it does and limit your losses as you go.
This is how to trade gold in action. It's not about guessing or gambling. It's about combining macroeconomic analysis with technical precision, then executing with disciplined risk management. The traders who consistently profit are the ones who follow a systematic process, trade after trade.
Avoiding Common Gold Trading Mistakes
Even if a trader has done an excellent job in their analysis of gold, several common mistakes can cause even the best traders to self-destruct. Part of learning how to trade gold is also understanding the things that you should avoid doing.
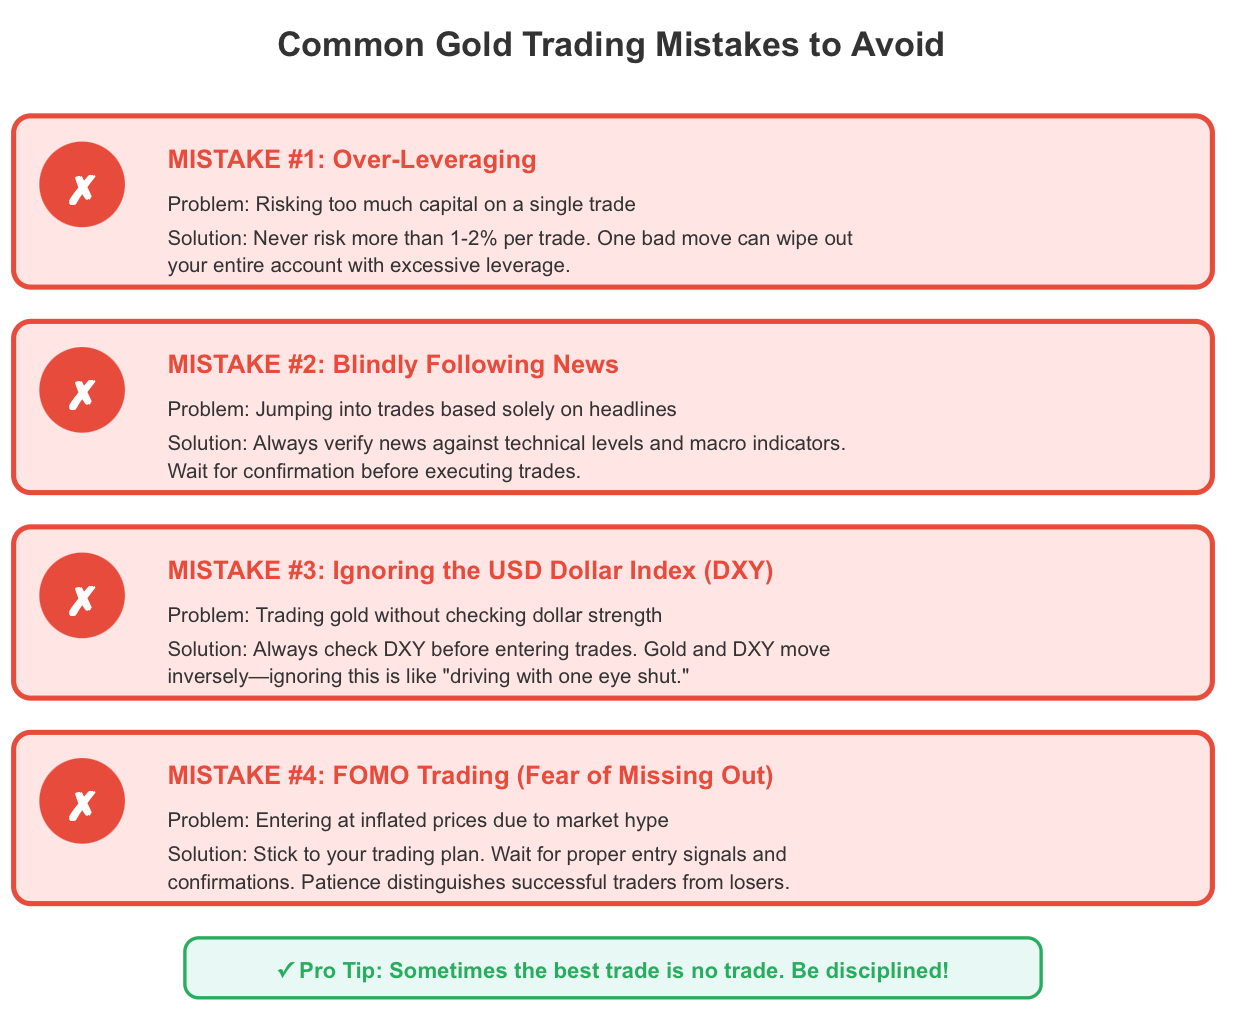
The leading cause of a trading account's demise is over-leveraging your trade. Gold is a highly volatile commodity, and if you over-leverage your position, you can completely wipe out an entire account with one poor trade. It is also important to remember that even if your analysis is correct, a price fluctuation in gold over the course of a day may result in your stop-loss being triggered before the trade has been completed. When trading gold, it is best to stay with reasonable position sizes and only risk what you are able to afford to lose.
Another trap traders frequently fall into is blindly following news releases or announcements. Just because the news announces something such as "Gold priced at 1000/oz!" doesn't necessarily mean a trader should immediately purchase it. Instead, a professional trader will verify the technical levels of the price action against the fundamentals of the news announcement or the macroeconomic indicators to determine if the anticipated move is likely to occur.
Gold's price can be highly unpredictable around important macroeconomic events, such as unexpected changes in interest rates or Fed speeches, and traders who do not perform proper analysis may find themselves on the wrong end of a mistrade.
Finally, a trader's lack of consideration for the US Dollar Index (DXY) is yet another error. The majority of traders erroneously ignore the US Dollar or trade exclusively off of gold charts. As we have covered, the movements of the DXY often lead the movements of the price of gold. Therefore, trading gold without considering the movements of the US Dollar is literally like driving with one eye shut.
Many new traders make the mistake of entering gold based on emotions (FOMO) because they're too caught up in the current "gold hype." After seeing that gold has been climbing in price and that everyone's talking about it, they jump in at an inflated price, only to see the price reverse. Before deciding to buy, always conduct research on the price action you plan to enter.
To avoid this problem, adhere to your trading plan and confirm your trading signals across multiple time periods on your charts. Be disciplined with your risk management; i.e., managing your risk is critical to successful trading. If a macroeconomic factor does not support a specific technical index setup, wait for a better opportunity before executing a trade. Having the discipline to wait for the appropriate entry point distinguishes successful traders from those who lose all of their capital.
Knowing how to effectively trade gold means knowing when not to trade. It may be the best decision at times to abstain from trading. Patience and discipline are equally important in the trading process as analysis.
Historical Gold Case Studies and Lessons
History teaches us powerful lessons about how to trade gold. Let's examine some key periods and extract actionable trading insights.
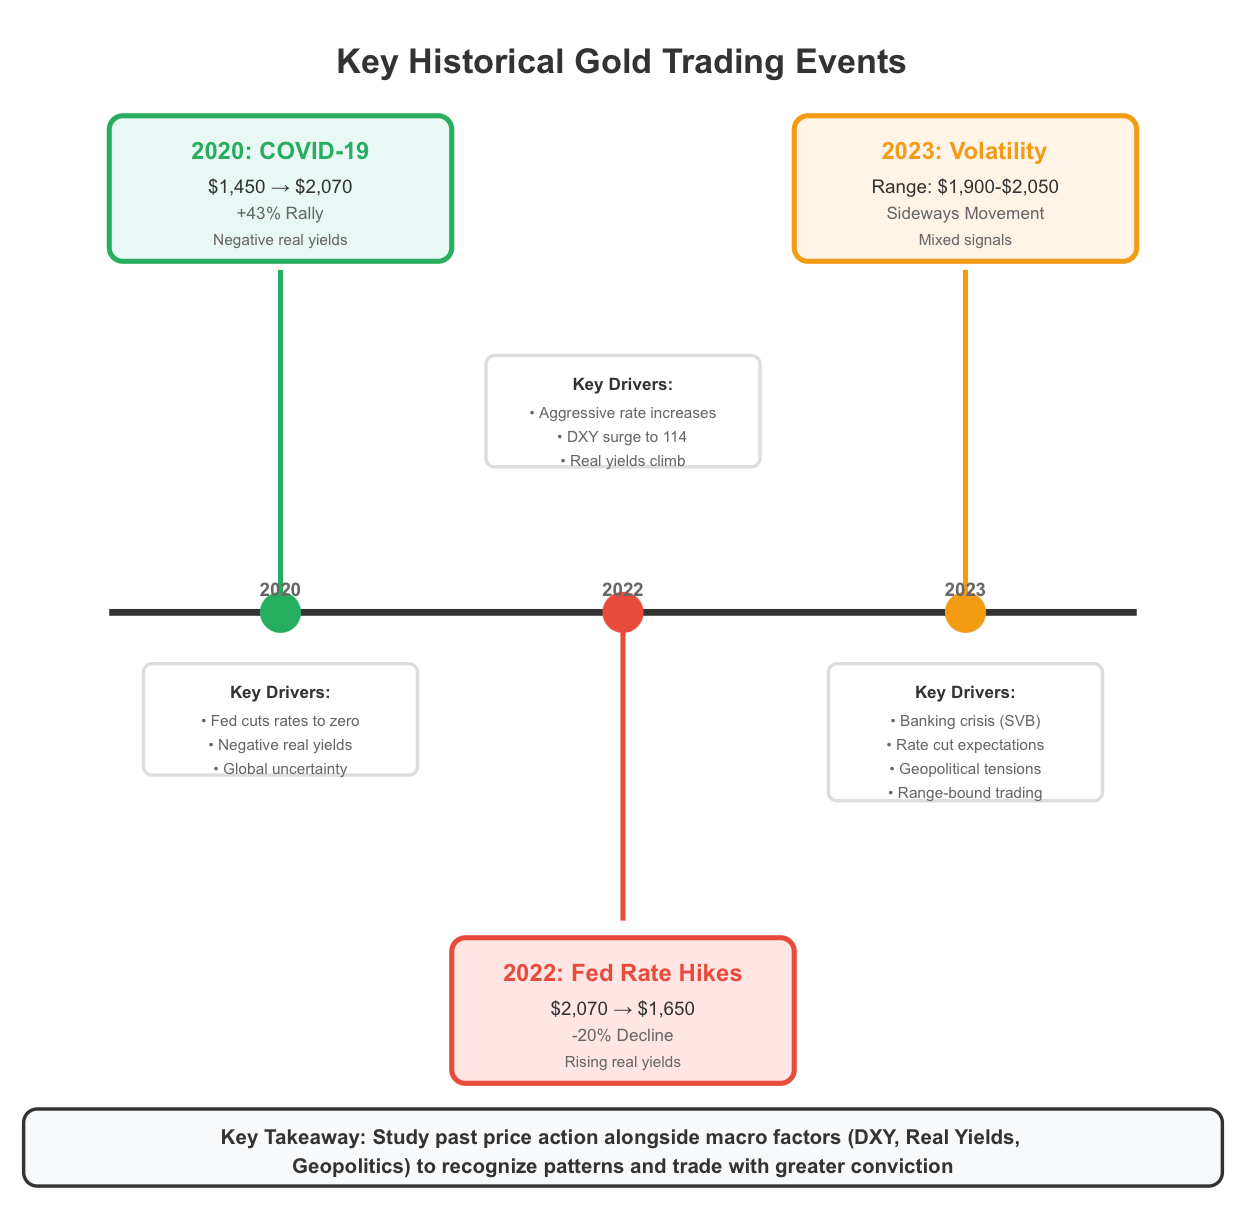
2020: The COVID-19 Pandemic
The pandemic created high levels of uncertainty in the worldwide financial market, and as a result, the Fed decreased interest rate levels to near zero. The result was significant declines in real yields moving into negative territory, creating the perfect situation for gold. Gold traded in the XAU/USD pairing increased from around $1,450 in March 2020 to an all-time high of over $2,070 in August 2020. Traders who saw declining real yields, geopolitical concerns and declining value of the U.S. Dollar were able to take advantage of these conditions to generate profits.
Takeaway: When real yields turn negative and uncertainty peaks, gold typically rallies significantly. The conditions created clear buy signals for gold, particularly when the price broke over resistance levels of $1,750 and $1,800.
2022: Aggressive Fed Rate Increases
In stark contrast to the prior year, 2022 presented a different economic environment for gold traders as the Fed raised interest rates at a record pace, which resulted in increasing real yields and increasing DXY value, all of which led to a decrease in the value of gold from the peak price of $2,070 to below $1,650. Traders who were able to understand the implications of rising real rates had options to either stay on the sidelines or to profit on the downside.
Takeaway: Where real yields are increasing, and the value of the dollar is increasing at the same time, gold faces a multitude of challenges in the market. Failed trades during this time were generally caused by traders fighting against the prevailing macro trend, buying every dip without a thorough understanding of the adverse underlying fundamentals.
2023: Mixed Signals and Volatility
Throughout 2023, prices of gold fluctuated significantly as investors reacted to different events, including changes in the Fed's target for interest rates, a number of banking failures, and ongoing geopolitical issues. The collapse of Silicon Valley Bank in March caused investors to sell bonds and purchase gold as a haven, briefly sending the price above $2k. However, as the expectation for the Fed to begin cutting rates continued to be pushed out in time, gold started to pull back.
A good takeaway from this environment is that when there is no clear trending direction, range trading tends to work better than attempting to follow trends. Specifically, the practice of buying gold near its support level ($1,900-$1,920) and selling when it nears its resistance ($2,000-$2,050) is generally a much more successful way to make money than trying to catch a final breakout to the upside.
Learning to trade gold effectively involves becoming more adept at recognising price patterns over time. Specifically, when you see the DXY (U.S. Dollar Index) falling, and gold holding key support, refer back to past price action and recognise price behaviour similar to what you see developing now, allowing you to act with greater conviction. Conversely, when you see rising real interest rates and gold struggling to maintain a resistance level, the historical evidence will always indicate that you should be a bear in that environment.
Therefore, as a trader interested in learning how to effectively trade gold, you should study historical prices for XAU/USD with regard to relevant macro factors such as the direction of the U.S. dollar, interest rates, and global political events. By doing so, you will move from being a reactive trader to an effective strategic trader.
Conclusion: Step-by-Step Guide to Start Trading Gold Today
Combining the three components of macroeconomic awareness, technical analysis, and disciplined execution is what makes up a successful trader of Gold. Throughout this guide, you’ve learned how to trade Gold by understanding the inverse correlation between the USD Index and Gold prices; looking for opportunity signals based on real interest rates; keeping track of Geopolitical events as they relate to Safe-Haven demand; identifying Resistance and Support levels from a technical perspective and using Realistic strategies with appropriate risk management.
Your trading Roadmap is very clear – Review Macroeconomic indicators (DXY, Real Yields, News) daily. Review your XAU/USD charts and look for Technical Setups. Wait until your fundamentals and technicals align. Enter with Stop Losses and Take Profits set in advance. Be Naturally Disciplined with Your Risk Management. Consistently track and review your trading performance so you can learn and develop yourself as a Trader.
For new traders, never start out live trading off the bat. Instead, open up a demo account and practice these strategies with no risk to your capital, as well as explore the various ways to approach Trading Gold, how Gold reacts to Market changes, etc. You should have a comfort level with your analysis before you risk any capital.
Ready to apply everything you've learned? BTCDANA.COM offers powerful trading platforms with real-time data, advanced charting tools, and competitive spreads on XAU/USD. Whether you're ready for a demo account to practice or prepared to trade live, the tools you need are waiting.
Start your gold trading journey with confidence at BTCDANA.COM. Access professional-grade charts, competitive spreads, and expert support to turn your XAU/USD analysis into profitable trades.