


Understanding Bearish to Bullish Reversals in Forex Markets
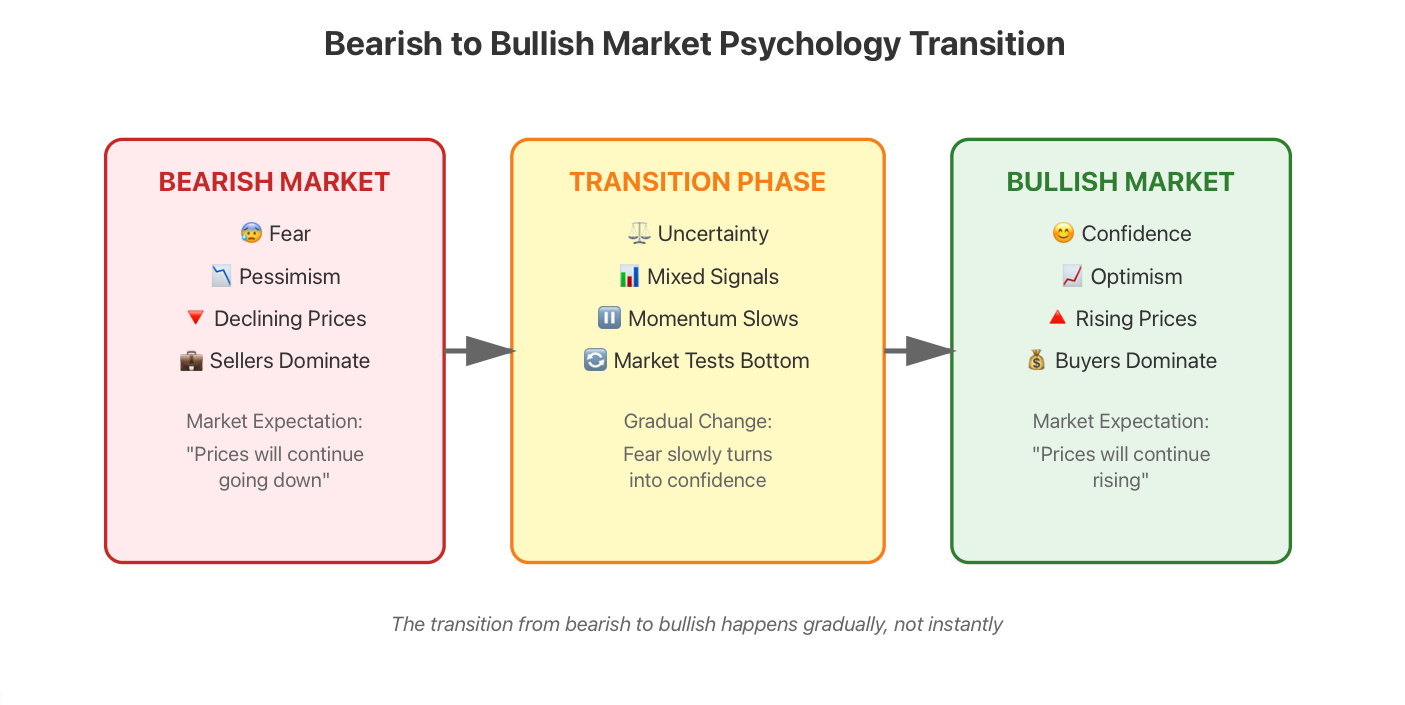
To recognise a change in the direction of the market, you first need to identify what you are looking for. A bearish market is when prices are declining over time due to fear and pessimism among the people. Imagine this as a long losing streak where sellers dominate, and everyone expects prices to continue going down. A bullish market is its own opposite. A bullish market is characterised by prices increasing over time because of greed, optimism, and a general change in attitude towards risk.
When does a bearish market become bullish in forex? The bearish and bullish markets are defined by changes in market psychology. When fear turns into confidence, that is when the downtrend will be defined as the end of a downtrend and the start of an uptrend. The switch from fear to confidence does not happen all at once-it happens gradually. Think of it as a large snowball rolling down a hill. The snowball slowly stops rolling, then changes direction and rolls back up the hill.
To provide a real-life example of the transition from bearish to bullish, let's look at the EUR/USD between 2014 and 2015. For many months, the EUR/USD went through what would be considered a classic bearish-to-bullish transition. Prices for this pair had been declining for quite a while, but as the ECB started to adjust its monetary policies and market sentiment also began to improve, the downward trend of the EUR/USD stopped and began to reverse. Traders who had identified the signals of this transition were able to position themselves to take advantage of potential significant increases in the price of EUR/USD.
For those new to forex trading, it can be helpful to think of your first vertical slide down a playground slide. When you arrive at the bottom of the slide (where your momentum has completely dissipated), you then turn around to begin climbing the stairs back up. While at the bottom of this slide, there was a pause in your progress before you started to go back up again, similarly, we aim to identify that "pause" phase of market structure within forex markets.
The first step in understanding the various phases of the forex market structure is to gain an understanding of how bearish and bullish phases operate. Having a sound grasp of these two phases will provide you with better insight as to when a bearish market becomes bullish in forex. This transition will not occur randomly; it will occur systematically. The transition will occur according to the patterns identified as well as psychological and technical signals, which I will elaborate on throughout this module.
Market Structure Analysis: Spotting the Bottom of a Bearish Market
Market structure is critical to a trader's success. A trader who can analyse the path of price action will see critical reversals before most others know what's happening.
In a bearish market, the trader will observe Lower Highs and Lower Lows. In a bear market, every time the price rallies, it will be at a Lower Peak than the previous rally, and every decline will create a New Low for that bear market. This is similar to a ball rolling down a hillside. It is bouncing along the way, but it always stops at a lower point than the last bounce.
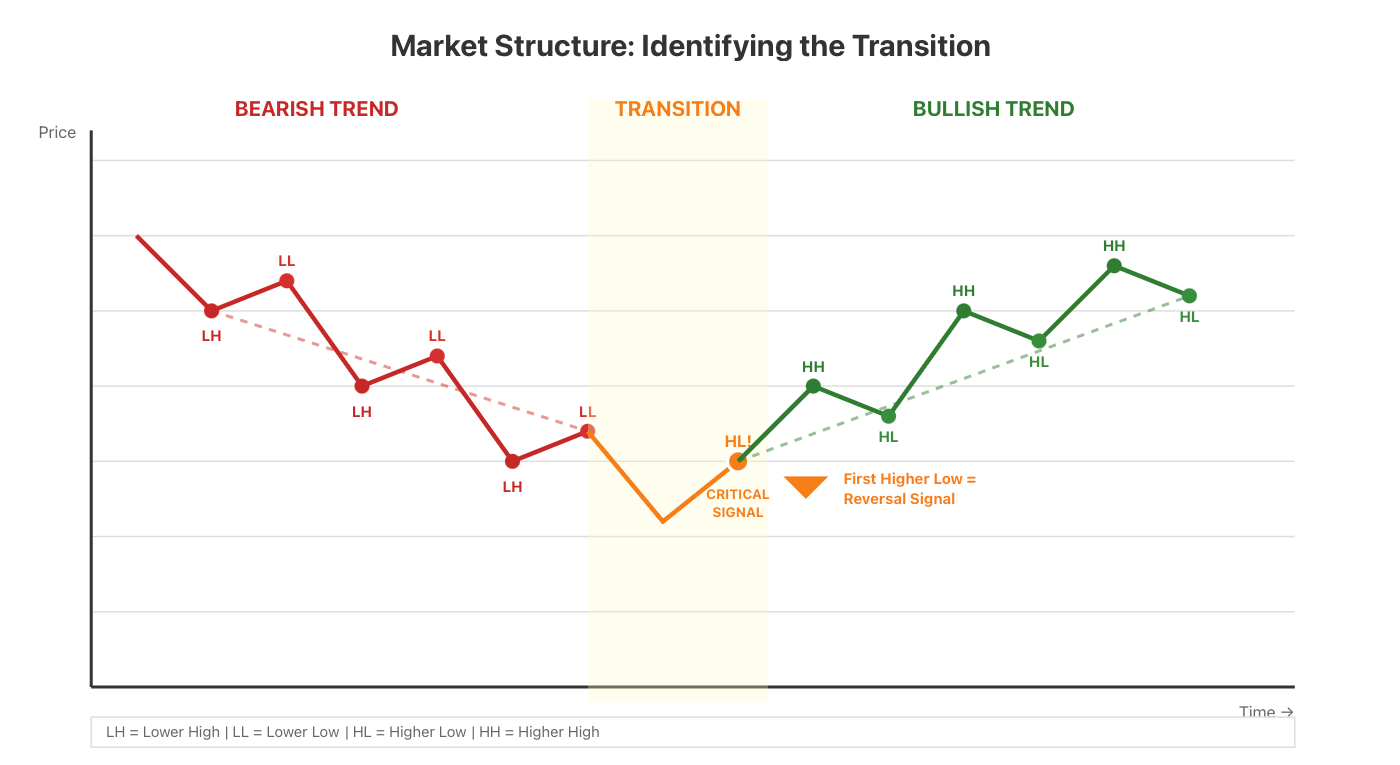
The most significant change from a Bear Market to a Bull Market in Forex is when the first Higher Low appears. When a Market makes a Higher Low, it means that the price has attempted to go below the previous Low but has been unable to. When that price action makes a Higher Low, that is the first structural signal of the Iceberg going Bearish and Bullish.
I will provide a scenario as a demonstration. In comparing GBP/USD, the series of lower lows made during bearish market periods can occur multiple times. However, as the trend forms, it may also provide the opportunity for a higher low to form. A higher low acts as a form of support where buyers enter with sufficient buying interest to stop further declines. If you observe a higher low being formed, the market has begun to transition into a bullish reversal phase.
Draw your line connecting all the lower highs and lower lows. You will see that the overall trendline should slope down. If you're able to break above the trendline that you have created and successfully establish a higher low, you have experienced a change in the market structure. Picture the market as a ball rolling toward the valley, where it eventually lands at the bottom of the valley and starts bouncing back up rather than continuing to roll deeper into the valley.
Before you place your trades, ensure that you take into account volume analysis and momentum indicators as well to support what you see forming. The higher low should also show an increase in volume; this indicates real buyer interest. You will want to look for any positive momentum indicators appearing at the same time; this will build your case more robustly.
The effectiveness of supporting price levels is proven through trend line analysis because a bullish trend will be evident the moment the price zone starts bouncing between price levels and creating higher lows at each time a higher low is created.
With that said, when your trending forex currency pair reaches a key support level with bearish momentum, but subsequently forms a higher low at that same key support level without breaking through, this is an indication that the currency pair will not go any further in the bear trend.
Remember, Higher Lows are your critical structural signal for spotting when a bearish market becomes bullish in forex. They tell you that the downward momentum is weakening and buyers are starting to gain the upper hand.
Momentum Confirmation: Detecting the Strength Behind a Bear-to-Bull Reversal
Structure is the map; momentum will tell you if there's any fuel left in the tank to reverse a trend. Without momentum, structural signals are just weak bounces that will eventually fade into an established downtrend.
Let's begin by discussing the RSI (Relative Strength Index). A bearish market pushes the RSI below 30, which indicates that the market is in an oversold condition (there is widespread fear, extreme selling, and the market is stretched to its limits). The question is, when does a bearish market become bullish in Forex? When you see the RSI bouncing off the oversold level and then crossing back above 30 and commencing its ascent to 50, the momentum has shifted from bearish to neutral or bullish.
Think of it this way: when a bearish market is actively working against a positive trend, think of it as a snowball rolling downhill faster and faster. As it rolls to the bottom, it slows down. This is what the RSI represents. When the snowball begins to move back up the hill, that's the sign of a momentum reversal.
Moving Average Convergence Divergence (MACD) is an excellent tool for recognising momentum shifts within markets. The MACD line is usually positioned below the signal line during a bearish trend, and both lines are currently below zero. A cross above the signal line (often referred to as a "Golden Cross") indicates that the momentum is beginning to shift; if both lines are above the zero line, then that's a strong confirmation that the momentum has completely reversed from bearish to bullish.
As an example, take the USD/JPY currency pair. On multiple occasions, this pair has bottomed out around the 25-30 level on the RSI scale, and when the price bounced back and moved higher, the RSI moved back up and crossed over the 40 level. At the same time, the MACD line created a golden cross and crossed above the zero line. Traders who were able to identify these two signals entered long positions at the beginning of the bullish phase.
The third element of momentum confirmation is volume. When you see that volume is continually increasing with an increase in price, that confirms that an influx of buyers is coming into the market. Conversely, low volume on an upward price movement indicates that there is little conviction behind this move and therefore it is likely to fail. Higher volumes show that a large amount of capital has moved into long positions.
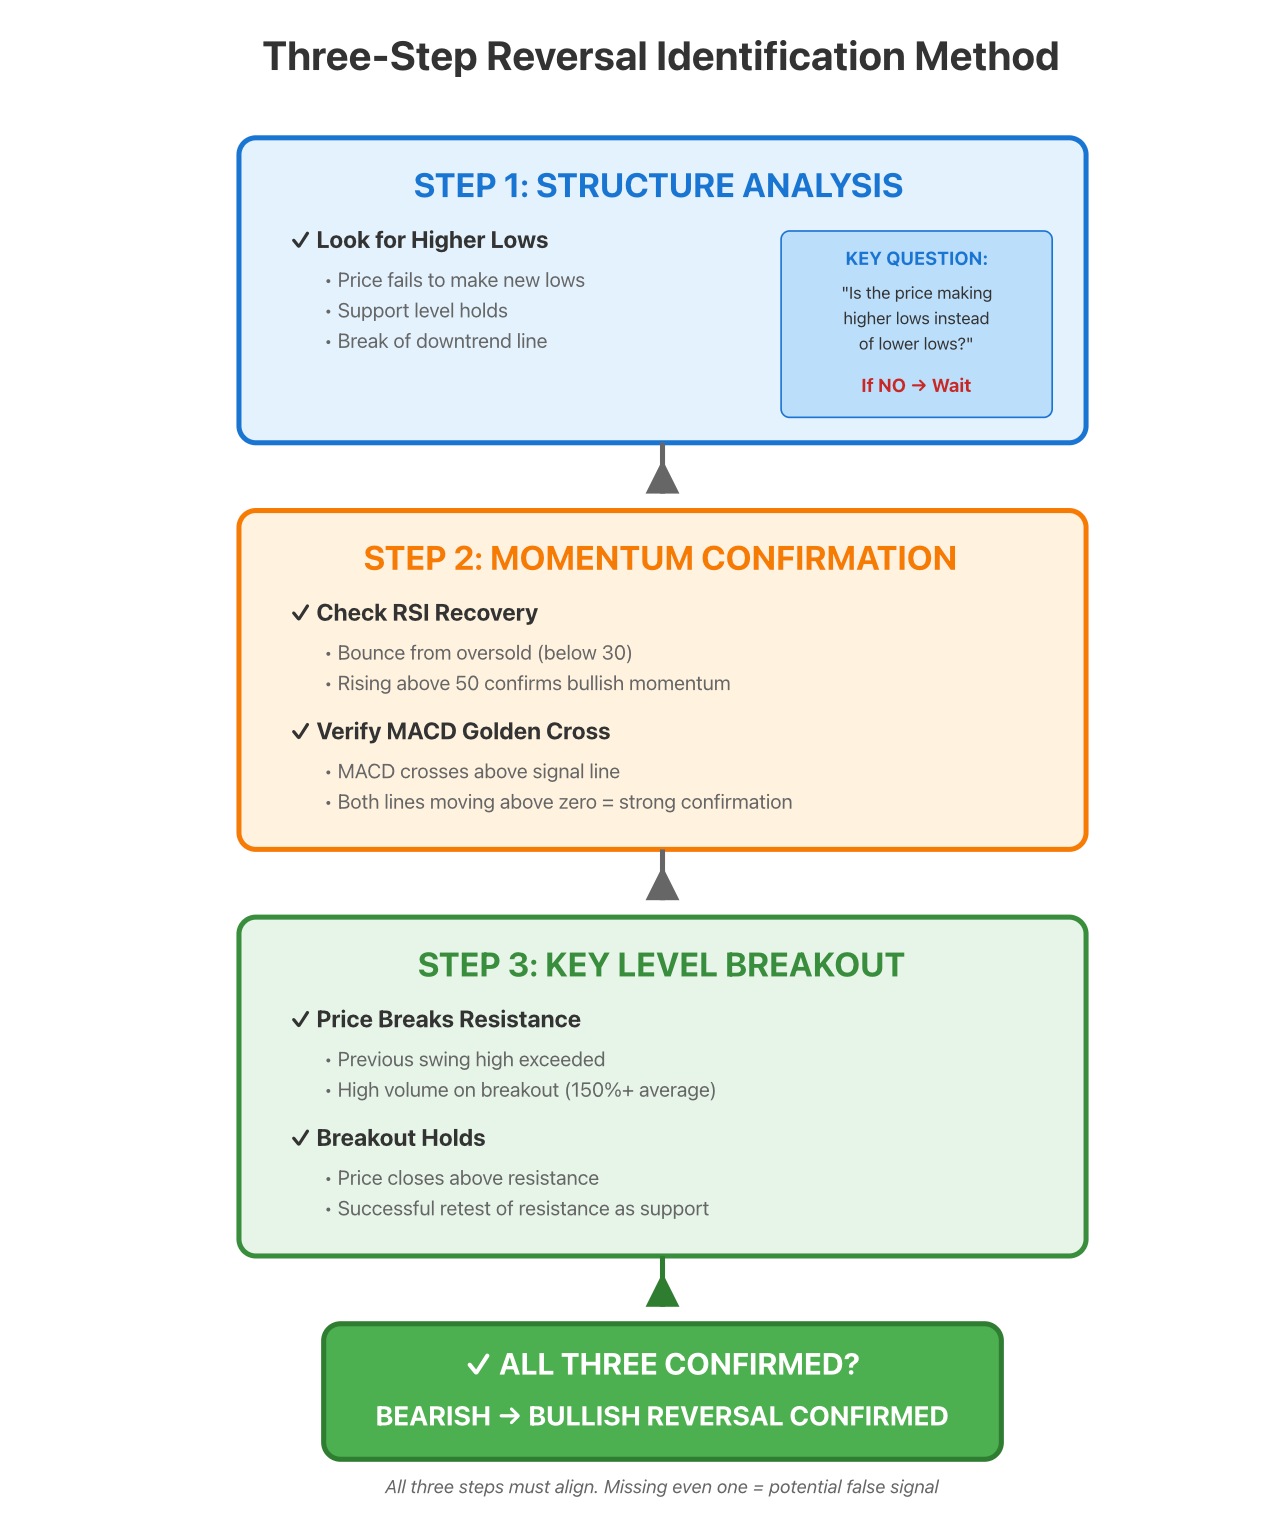
Create your own combination of momentum and confirmation by observing what Higher Lows are forming relative to the structure of the market. If you observe a Higher Low forming while the RSI returns from Oversold territory, along with a Golden Cross (when the MACD crosses above the signal line), then you have received three pieces of confirmation. This is when a Bearish Forex Market can return to a Bullish trend with reasonable confidence.
Using only one indicator is not recommended, as there is always a chance that either one or both of those indicators could be giving an incorrect signal. Use both RSI and MACD; however, for example, if you see a bounce in the RSI but MACD remains down, then wait! If MACD crosses (bullish) and the RSI remains down or is falling, then again wait! We want multiple momentum signals lining up with your structural analysis before putting forth capital.
Key Level Breakouts: The Final Confirmation of a Bear-to-Bull Reversal
You've noticed a shift in market structure with increasing lows points and have also established that momentum is shifting upward. The next step is to identify key resistance levels, or "ceilings" for price action, which historically held or pushed a price lower, as the market transitioned from a bearish to bullish phase. The price needed to move through those resistance "ceilings" in a strong manner, signalling the confirmation of the shift from bearish to bullish.
If you're picturing price moving through the resistance level like a person swimming through the ice-covered lake, just as a swimmer can only swim when there is no ice in their path, when price breaks through the resistance, it flows upward.
Looking at an example, AUD/USD has been in a bearish market since early 2020. As this pair began to see support with increasingly higher lows and positive momentum, they needed to break the previous high swing low, and once it did this successfully with volume, the bullish to bearish confirmation was strengthened, and the price continued to rise.
The issue with false breakouts is that sometimes the price goes above a resistance line for a moment, then goes back down again. This is when all three components come together to show a valid breakout. A valid breakout will be:
1. Structural confirmation: the price will form higher lows before a breakout
2. Momentum confirmation: the RSI should be moving upward, and there should be a MACD golden cross
3. Volume Confirmation: The breakout happened with high volume
If you see a broken resistance level with low volume and weak momentum indicators, be cautious and wait until the market closes above the resistance line and stays above it for several candles. Many professional traders wait for a retest of broken resistance to see if the price will pull back to test it as support before continuing to rise. A retest allows the trader to enter with lower risk and with more protection.
The most common ways to determine where to find support and resistance levels are based on:
-
Prior swing highs and lows
-
Round numbers
-
50-day and 200-day moving averages
It is best to identify and prepare for support and resistance levels ahead of time so you are aware of where to focus your attention.
When a resistance level is broken, and there is confirmation of all three factors noted above, you can be 100% confident that a bearish trend is now a bullish trend in the forex market. You have structure, momentum, and a breakout through a significant resistance level, all pointing in the same direction; thus, it is your signal to buy.
Three-Step Method in Action: Combining Structure, Momentum & Key Levels
Let's put it all together and see how this three-step method works in real trading scenarios.
Step 1: Structure – The first step to identify a reversal for the EUR/USD pair is to observe higher lows being established during a downtrend. This indicates that downward momentum has started to decrease, and therefore, you should consider that a reversal may be occurring.
Step 2: Momentum – The second step to confirm that a reversal is happening is to verify the momentum indicators. The RSI should show a bounce off the oversold level, and the MACD will typically show a Golden Cross for momentum that indicates building purchasing power.
Step 3: Key Level Breakout – The third step is to verify that a breakout has occurred by waiting for the price to move above a key resistance level and confirming that the breakout is sustained by high volume. This is the final confirmation of a bullish reversal with sufficient power to continue in an uptrend.
Let me give you a basic example of how all three of these confirmations would work when trading EUR/USD on a 1-hour chart during a bearish market. Let's assume that you have been following EUR/USD as it formed lower lows for multiple days.
You then notice:
-
The price had established a higher low at about 1.0850
-
The RSI had risen from 28 to 45, and the MACD had crossed over the bullish trend
-
The price had moved above the previous resistance level of 1.0900 with high volume
In conclusion, bearish markets have turned bullish, as confirmed by all three parts of the three-step method for confirming a change in momentum of price trends. Therefore, it is reasonable to enter an extended position at this stage with a stop loss on or near the last established higher low (under 1,1800) target price, being the next resistance point identified (at or around 1,2000).
Let's take a look at a real-world example using a daily chart of GBP/USD. If we were to look back through the historical price trends of the pair dating back before early 2021, we would clearly see an extended bearish trend bottoming out in late 2020, with the last established higher low being around 1,1800. Applying the three-step method, you would have seen:
-
Structure: The establishment of multiple lower lows was followed by the creation of a higher low (1.1800), which was confirmed as the last higher low.
-
Momentum: Over two weeks, the RSI rose from 32 to 51 while MACD crossed above zero and formed a golden cross.
-
Breakout: Price action broke out past the 1.2000 resistance barrier with strong volume supporting it.
This was not simply a chance. The methodical nature of the three-step method for confirming a change in momentum continued to keep traders who decided to enter positions after the breakout on a strong upward movement for the following months.
Keep in mind that with each step, naturally, ask yourself when a bearish trend begins to turn bullish in Forex. If a structural change takes place without the accompanying momentum confirmation, the answer is "not yet." If a structural change takes place with the accompanying momentum confirmation, and it does not break through a key level, then again the answer remains "not yet."
The answer is only confirmed when the structural change, momentum confirmation, and key level break all synchronously confirm the bullish trend. To practice this methodology on the Historical Chart, look back through the EUR/USD, GBP/USD, or any other Major Market Currency pairs for where the three indicators are aligned. You should be able to observe that this occurs repeatedly across each pair.
The "Litmus Test" of Reversal: Using Technical Indicators with Support/Resistance
In this article, we will look specifically at using MACD, RSI, and Moving Averages when trading foreign exchange markets to confirm the transition from a bearish to a bullish market.
MACD: In a bearish market, the MACD indicator is below the 0 value line. When the MACD line is located below the Signal line, you'll begin to see the initial signs of potential reversal by observing the golden cross of the MACD line (cross above the Signal line). The full confirmation of the transition to a bullish trend occurs when the MACD crosses above the 0 value line. When the MACD crosses above the 0 value line, you'll know momentum has completed a full transition from net bearish to net bullish.
RSI: The RSI indicator confirms the reversal of a bearish market in two ways. The first is the rebound of the RSI from the oversold condition upward into the range of greater than 50. This indicates the end of the extreme selling pressure of the bearish sentiment and establishes neutral to bullish momentum. The second is the dual confirmation provided when the RSI rebounds from the oversold level at the same time that the price crosses above a significant support level.
Moving Averages: Both the 50-day Moving Average and the 200-day Moving Average are dynamic S/R levels. The breakout of the 50-day MA (above) is a signalling event that will occur before or at the same time as the breakout of the 200-day MA; therefore, it usually provides an early warning that a trend reversal is beginning.
Combining everything now. One way to view the EUR/USD in a downtrend is that it is trading below both the 50-day MA and the 200-day MA, and has just tested a significant support level at approximately 1.0500. When this occurs, you should confirm that you have:
A Support Bounce indicating that it has bounced off 1.0500.
-
An RSI Back to Above 50: the RSI has moved back towards 50 from under 28.
-
A Golden Cross MACD indicates that the MACD lines have crossed. Therefore, the trend may start to reverse.
-
A Break of the 50-day MA: The price has closed above the 50-day MA.
-
A Break of the Previous Swing High: The price breaks above the previous swing high that is drawn on the chart.
Each piece confirms the others, so if you have a support bounce without a rising RSI, that indicates weakness. If you have a rising RSI but you do not have a break of a 50-day MA, then that indicates high risk. However, once you have all of these pieces lined up together, you know the reversal has been confirmed.
Here's an example of how professionals might analyse price movement using the GBP/USD pair. For example, when the GBP/USD was at its lowest point of support on the 4-hour chart, the Relative Strength Index (RSI) indicated an oversold condition of around 25. This level acted as a launching pad, causing the price to increase over time and subsequently cause the RSI to rise from 25 to 55. In addition, this period also experienced the formation of a series of "golden crosses" on the MACD, and by that same period, the price had crossed above the 50-day moving average.
Because this combination of signals was available to traders before they entered the trade, those who positioned themselves at that time invested with very high confidence.
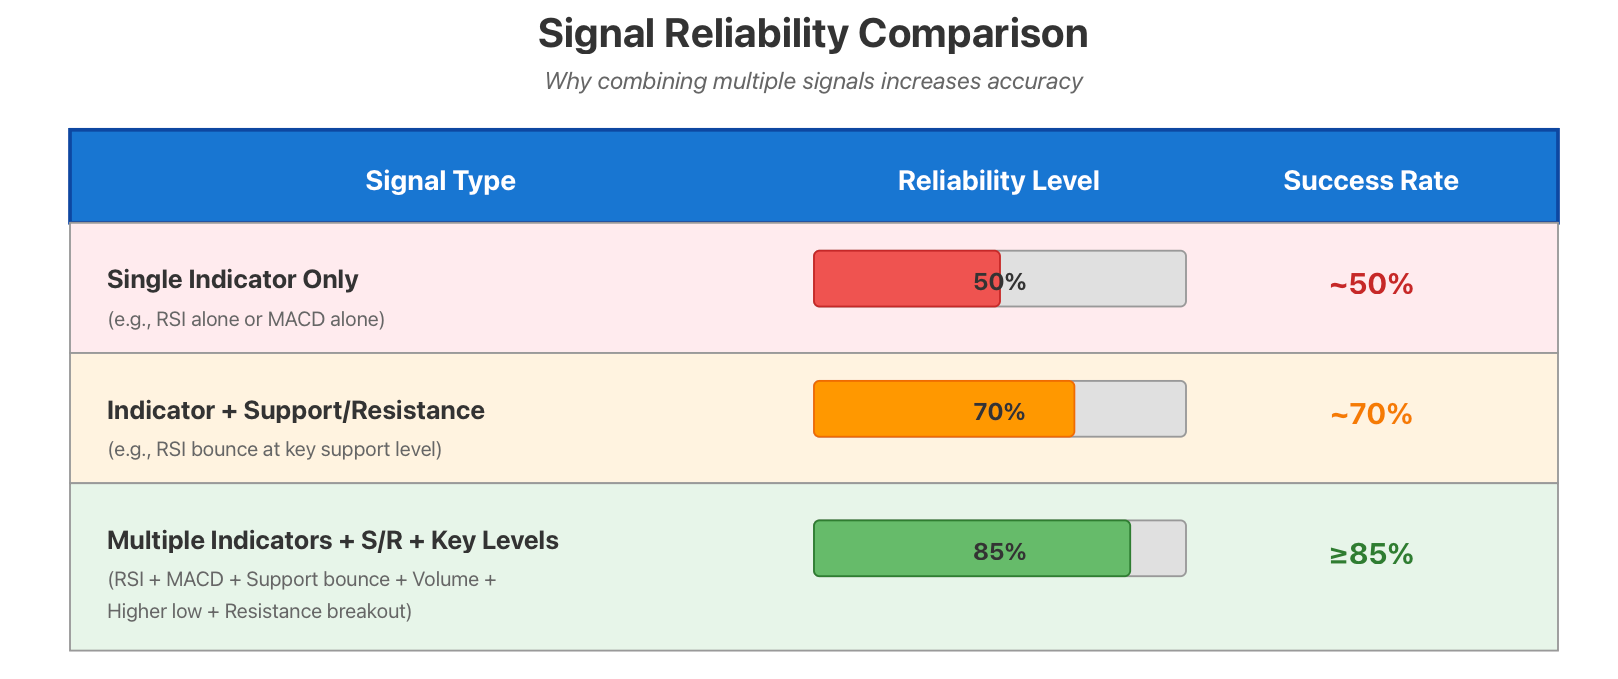
The Comparison Table Represents The Following:
-
Signal Indicator Alone = 50% Reliable
-
Signal Indicator + Support/Resistance = 70% Reliable
-
Rainbow of Signal Indicators + Support/Resistance + Key Levels of Support = 85% Or Greater Reliability
Do not use MACD or RSI as isolated indicators. For example, a MACD golden crossover in the middle of the trading range of GBP/USD has no conformance; however, when the MACD golden crossover occurs upon the break of a resistance level after the price has bounced off of support, then you have a great deal of confirmation of the transition from a bearish market to a bullish market, and a high probability of success for the trader.
Always consider these indicators as confirmation tools, and always integrate your technical analysis of support and resistance when making your investment decision. This is the method that professional traders utilise to differentiate between statistically probable setups and statistically improbable setups.
Macro Drivers: How Central Bank Policy & Interest Rate Expectations Trigger Reversals
The study of prices and volume through graphs, patterns and indicators can help determine a reversal in price action, with the underlying reasons why a reversal would occur based on economic principles, especially interest rate expectations and central bank policies.
The central bank is responsible for controlling the money supply and monetary policy of a Country, which directly affects currency values. When a central bank reduces interest rates, it stimulates the economy through reduced borrowing costs. During the first few days after an interest cut, the currency becomes weaker as borrowers pay more to borrow money; however, if during that time and afterwards the central bank cuts interest rates sufficiently to prevent recessions, that currency can appreciate.
Similarly, when central banks increase interest rates to address inflation, they increase the value of their currency because it is now an attractive investment for yield-seeking investors. However, markets do not only react to actual policy decisions; they also react to expectations of those changes. In other words, if a trader expects the central bank to announce rate cuts in the next six months, they may sell that currency today in anticipation.
For example, in the case of the Federal Reserve cutting interest rates because of poor economic conditions, the U.S. dollar (USD) depreciated initially against many major currencies. However, as the economy stabilised and consumer confidence began to improve following the interest rate cuts, the USD eventually reached its lowest value before reversing direction and rising in value.
The traders who combined this macroeconomic knowledge with technical analysis were able to identify this reversal many days before the actual trend reversal occurred. The policy guidance that we saw happen and was adopted by the European Central Bank during the transition from 2022-2023 is an excellent example of how this transformation worked. The ECB transitioned from being dovish (rate cuts/stimulus) to hawkish (hike rates).
You can see the change by looking at how the euro transitioned against many major currencies; it was once in a highly bearish trend, now it is in a very bullish trend. The macro driver behind the change was the shift in interest rate differentials that began supporting the euro. The market price of the euro has been influenced by many factors; the indicators that comprise your interest rate expectations are Economic Data Releases, Central Bank Forward Guidance, and Market Implied Rate Probabilities.
The current interest rate expectations are providing the tools for measuring changes in interest rate expectations and will remain there as a source for measuring interest rate expectations.
You can view the changes occurring through indicators on a time-based basis:
-
Stage 1: The Central Bank's Signal that indicates a future policy change.
-
Stage 2: As a result of the anticipation of the change in policy price, the euro market price dips low before it rises back up again.
-
Stage 3: The policy change is enacted by the Central Bank.
-
Stage 4: The currency reverses from a bearish trend to a bullish trend, with technical confirmation.
You should look for macro drivers while utilising the 3-Step Technical Method. If you see the Fed policy expectation change from "More Cuts Ahead!" to "Holding Steady or Hiking," and at the same time, you see DXY has formed higher lows and has a higher value coming out of a lower number with RSI moving upward, this indicates that a macro and technical alignment exists.
Keep an eye on the major central banks: the Federal Reserve (USD), the European Central Bank (EUR), the Bank of England (GBP), the Bank of Japan (JPY), and the Reserve Bank of Australia (AUD). Many traders look to the policy meetings of these central banks and the guidance they give when determining when a bearish market is going to become bullish in forex.
Do not base your trading decisions solely on macroeconomic factors. A rate cut does not necessarily mean that we should expect a reversal. You should also incorporate your three-step technical process to find the most probable setups based on the fundamental catalyst.
False Signals vs Real Breakouts: How to Avoid Fake Reversals
Most traders get into trouble when they see something that appears to be a reversal, they get excited and enter a trade, then they watch as the market reverses back down. The ability to separate false signals from actual breakouts will save you from losing lots of money.
A false breakout occurs when price action briefly pushes through a critical level, such as resistance, only to have the momentum dissipate before it can actually maintain the escape. Think of a false breakout like a basketball player faking one way and then quickly changing directions. Markets can do the same thing.
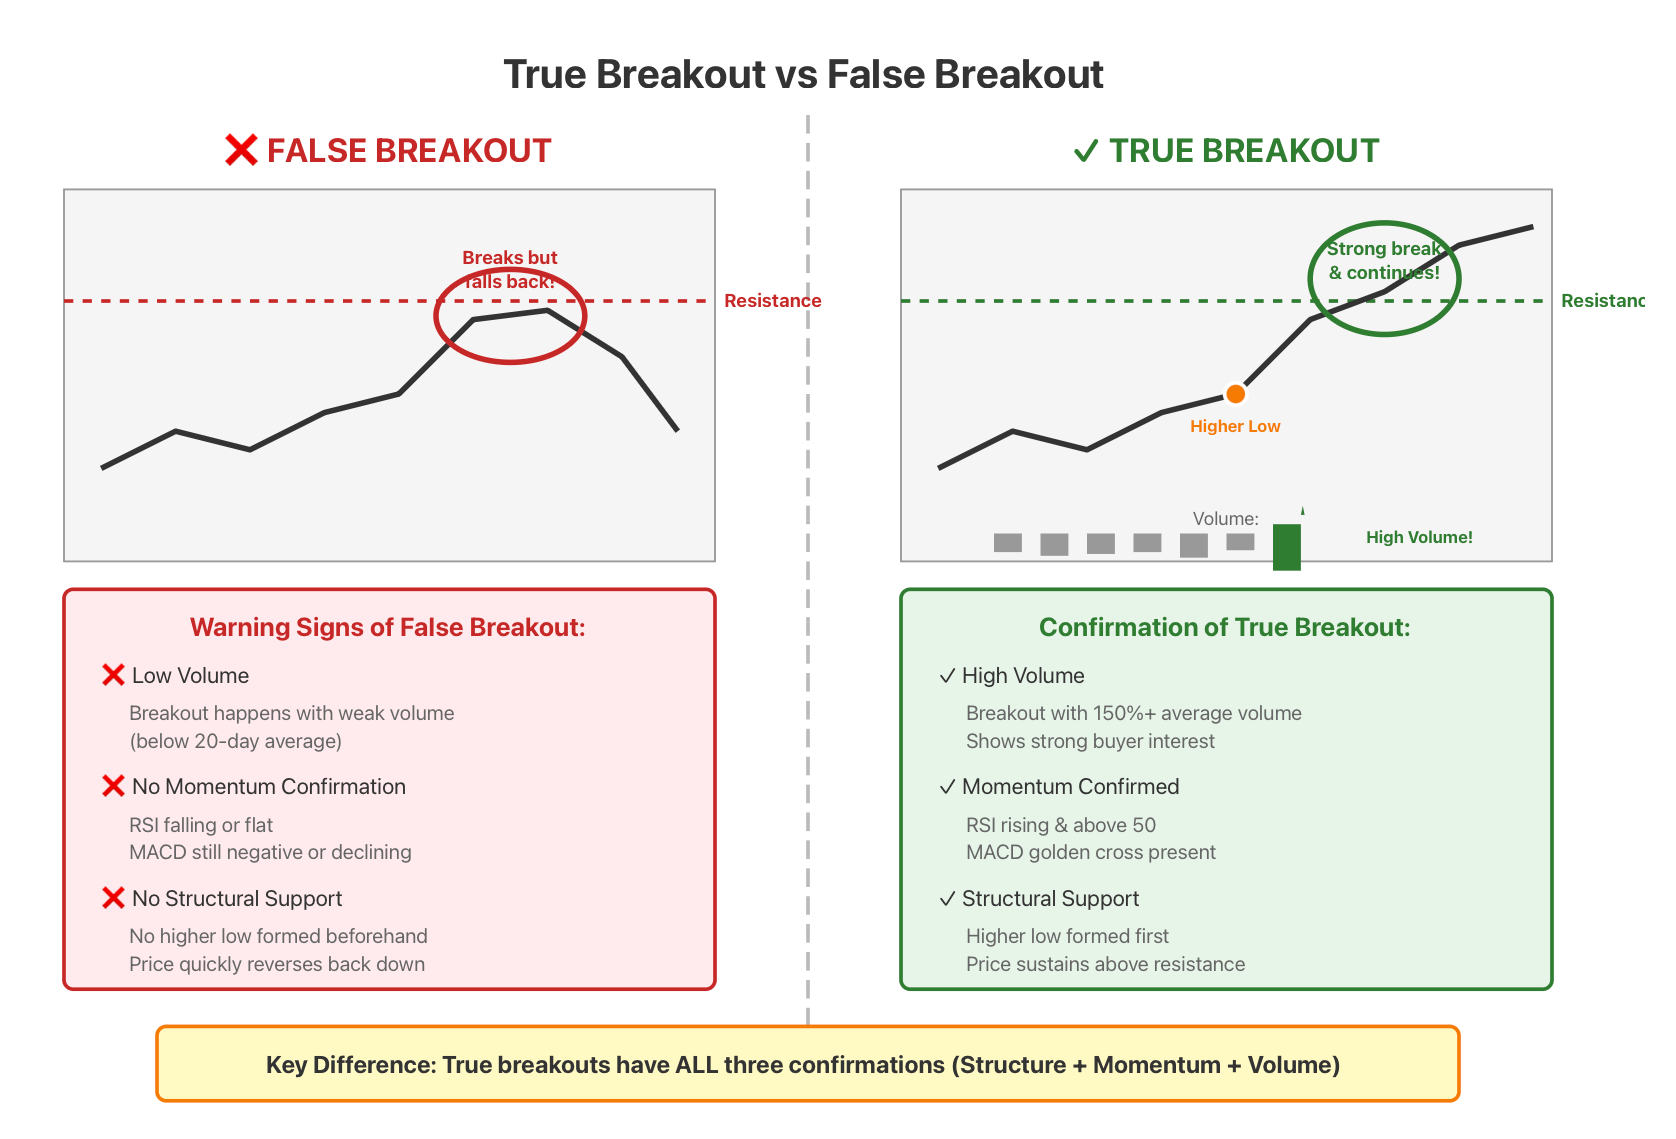
How can you identify a false breakout before experiencing financial pain? Watch for the following signs:
Low Volume: True breakouts occur on high volumes of trading activity. When resistance breaks on lower volumes than expected, that's a warning sign. This means that not enough buyers are supporting this breakout.
Momentum Indicators Not Confirm: When price breaks through a point of resistance, but RSI is still falling, or MACD is still negative, something is wrong. True Breakouts have momentum behind them.
No Higher Low Exists within Structural Patterns: This implies that there was no formation of a valid higher low after the price moved through the area of resistance; thus, the structure failed to confirm the expected reversal. Therefore, your investment decision was merely an emotional reaction, resulting in a rapid upward price spike that will not last long enough to recover your losses.
I'll give you a simple example. Suppose EUR/USD is trending down, and then it goes above a previous high, which was at 1.1000. This move could be exciting. However, when examining the trade, we note that the volume is less than average. We also see that the RSI indicator is at 48 and appears to be going down. Also, when looking at the structure of the price, we can see that it has not formed a higher low before breaking out above the 1.1000 level. Therefore, this breakout is probably false. Most definitely, EUR/USD drops below 1.1000 after just a few hours.
Next, we will examine a true breakout, which was GBP/USD. GBP/USD formed a higher low at 1.2500; the RSI recovered from 30 to 55, the MACD generated a golden cross, and GBP/USD broke the 1.2800 resistance with a volume that was 150% higher than its 20-day moving average. GBP/USD closed above the 1.2800 resistance level for the following three consecutive days. Thus, GBP/USD is a true breakout that has structure, momentum, and volume.
If you look at historical data for both EUR/USD and GBP/USD, you will see that false breakouts typically retrace within one to three days, and true breakouts will last for weeks or even months. The only thing that makes the two different is the confirmation of the breakout.
Here's your checklist before trusting any breakout signal:
-
✓ Higher low formed first?
-
✓ RSI and MACD confirming?
-
✓ Volume above average?
-
✓ Price closes above resistance?
-
✓ Retest holds?
If these checkboxes are not marked, then just wait. The only thing that will save you is patience. If you are patient and you miss the first 10% of a legitimate market move, then you will not lose 20% to a false signal.
Professional traders almost always wait for a retest and hold before buying. This happens when the price breaks through resistance and then returns to retest resistance as support.
After the retest has occurred, this can then confirm to you that the price has held at new support, giving you a good entry place and a tighter stop loss than entered before.
When does a Bearish Market become a Bullish Market in Forex? A Bearish Market becomes a Bullish Market only when multiple confirmations line up together. Therefore, to confirm that the price is either reversing or fooling you, do not depend on just one breakout.
Instead of depending on a single breakout, look for combinations of structure, momentum, key levels, and volume to separate a real reversal from a false-out.
Short-term fluctuations will always fool you if you are not patient. To find out about the reality of price reversals, you need to zoom out and look at various higher timeframes, i.e. 4hr and daily.
Risk Management and Practical Tips
All the signals for reversals in the world will not help you if your risk management strategy is weak. At times, even the best setups will fail, and that's just the nature of being a trader. Here are some ways to protect yourself while you are hunting for bearish-to-bullish reversals:
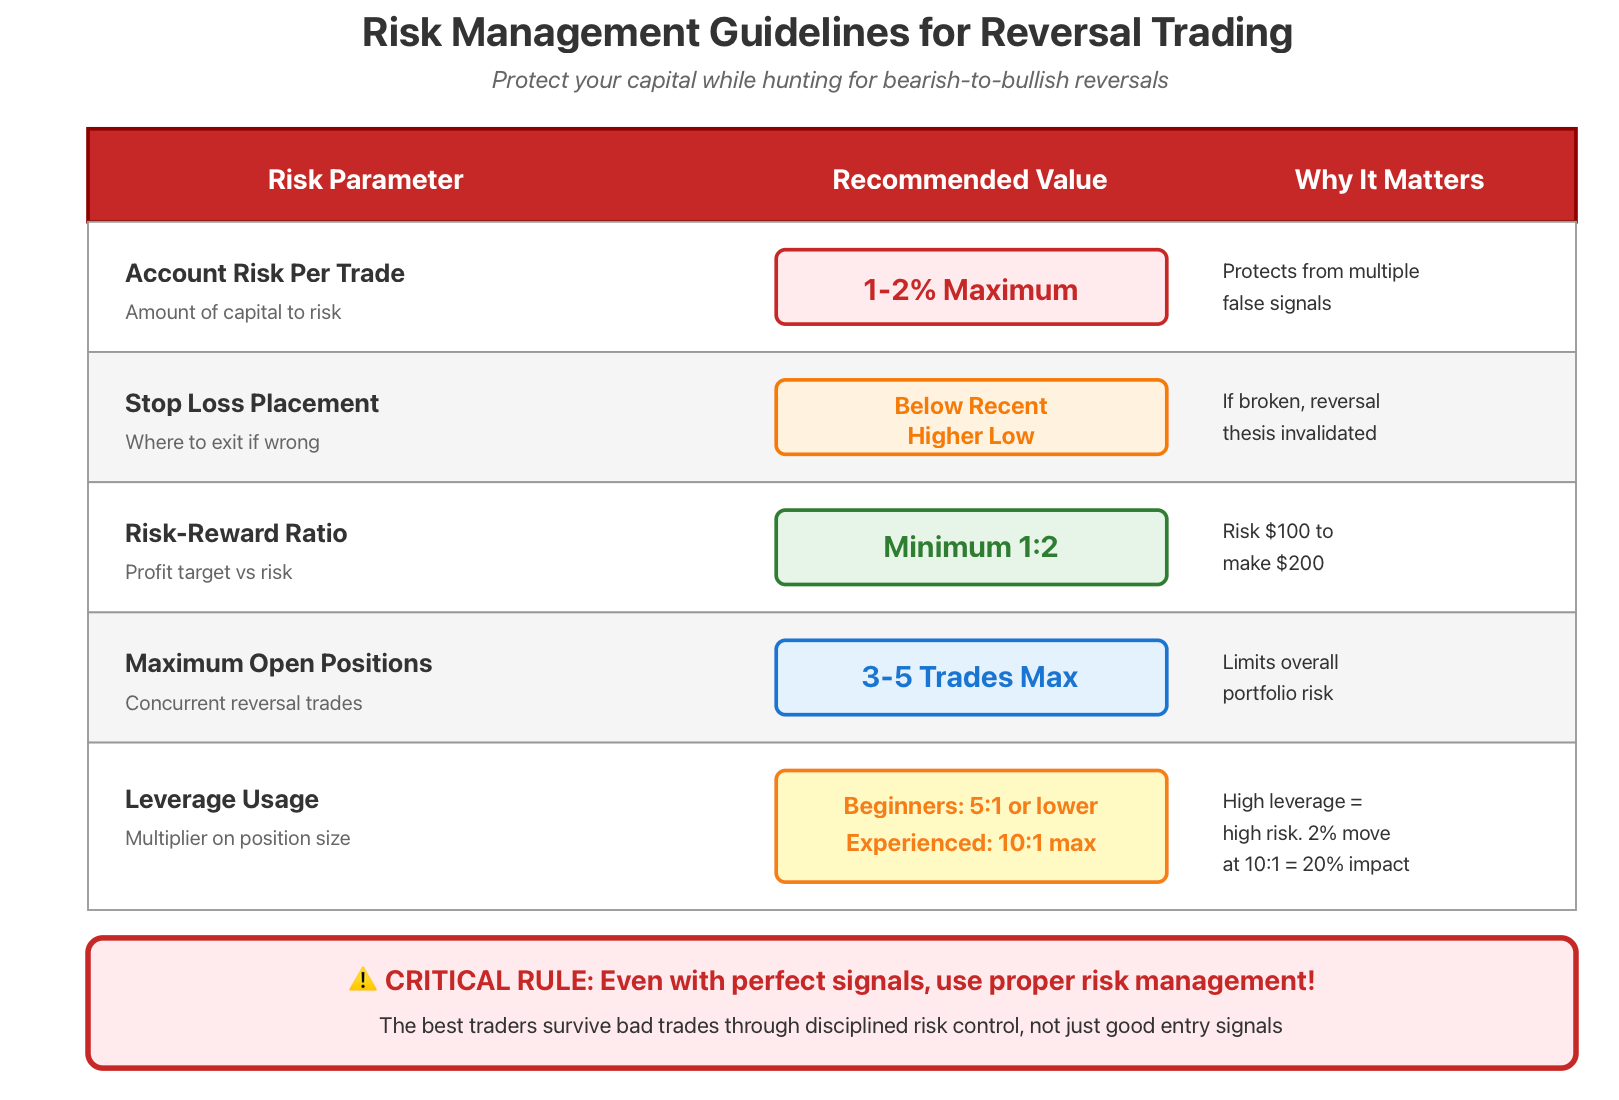
Stop Loss Placement: Stop Loss Placement is a must; always place a stop loss. In the case of a reversal trade, you should place your stop below the most recent higher low. If this is broken, your thesis on the reversal has been invalidated; do not allow emotion to take over. Let the stop loss do what it is supposed to do for you.
Position Sizing: Position Sizes should not exceed 1-2 per cent of your total account balance on a single reversal trade. A reversal trade can be highly volatile, especially if you are attempting to catch the reversal early; therefore, proper position sizing means that you can withstand several false signals before you hit the real reversal trade.
Volatile Markets: High Volatility Levels are when most reversals take place, this is frequently due to economic news releases, Central Bank Statements or geopolitical events (for example, Iran). Because of these events, it also means you face the risk of being whipped back and forth; therefore, widen your stops or decrease your position size for these types of trades.
Here's an illustrative example suitable for a beginner. If you are new to trading, open a demo account on a platform such as BTCDana and practice with it without using real money, while developing your own understanding of the three-step method for entering and exiting trades. Be sure to keep records of all entry/exit dates and results. After trading profitably using a demo account for two full months, consider opening a live trading account, but start small.
For those currently trading with a live account, I suggest that if you're using significant amounts of leverage, you should exercise caution. The more leverage you use when trading, the more impactful the trade's movement will be on your account equity (both positive and negative). For instance, if you have a 10:1 leveraged position and it moves against you by 2 per cent, this translates to 20 per cent of your account being wiped out.
When using leverage to trade reversals, it is advisable to utilise smaller position sizes based on how much additional risk you are assuming.
Multi-Timeframe Analysis: It's important not to focus on only one timeframe. A good way to validate what you observe on the 4-hour chart is to check for similar trends in the daily chart. If you see significant bearishness on the daily chart and a bullish reversal taking place on the 1-hour chart, you may simply be identifying a minor bounce in a bigger downtrend.
Multi-Market Confirmation: When analysing the EUR/USD for bullish reversal patterns, always confirm your analysis against the US dollar index (DXY). If the EUR/USD is exhibiting bullish signals, but the DXY is extremely bullish, be very cautious. One of those indicators is sending a false signal.
Here's a risk management table to follow:
-
Account Risk Per Trade: 1-2% maximum
-
Stop Loss: Below the recent higher low
-
Risk-Reward Ratio: Minimum 1:2 (risk $100 to make $200)
-
Maximum Open Positions: 3-5 reversal trades at once
-
Leverage: 5:1 or lower for beginners, 10:1 for experienced
Scenarios should be simulated before trading. One question to consider is, "What happens if this is a false breakout? Where will the market move? What would the loss amount to?" If these answers cause discomfort, decrease your position size or simply do not take the trade.
The Answer to The Question of when a Bearish Market Turns into a Bullish one in Forex is that, After Numerous Confirmed Signals are received, Even When You Have Confirmation, it is Critical to have the Right Risk Management Strategies as well. Signal Confirmation and Risk Management Together are Important for Longevity and Success.
Until the Three-Step Method Becomes Second-Nature, Practising on Demo Accounts is the Best Choice, then Trade Small Amounts of Real Money; There is No Need to Rush into Trading Large Amounts. Start Slow and Build Your Confidence and Account Balance Gradually.
Summary and Action Plan
Let's recap everything you've learned about identifying when a bearish market becomes bullish in forex.
The price pattern indicates that we should look for a series of higher or lower lows formed after making lower highs and lower lows. To prove momentum behind your bullish or bearish reversal trade, you should look for a clear bounce-back in the RSI from oversold conditions and a golden cross in MACD. A price crossing above key resistance should be accompanied by a significant increase in volume.
You can also use technical indicators (RSI and MACD, Moving Averages) and combined with the elements of support and resistance, are a great way to verify reversals. Economic conditions (central bank policy changes and interest rates) should be fully understood before attempting to trade.
Another level to be aware of is false breakouts. Volume, momentum, and structural confirmation should be evaluated before entering into a trade.
It is essential to effectively manage risk when entering a new trade through the implementation of stop losses and the determination of position sizes. Additionally, consistently practising and analysing multiple timeframes while trading reversals is imperative for success when attempting to trade reversals from bearish to bull market conditions.
Along with the ability to apply learned concepts through practice using historical charts of the selected trading pairs, it is also equally important to continue practising in real-time using a demo account on the selected trading pairs over time until a trader can determine, with certainty, that all three components of a trend reversal have aligned in their trading environment. By practising as described above, a trader can then document their analysis of a trade at the point that they believe to see a reversal, whether the market confirms their analysis and causes a breakout.
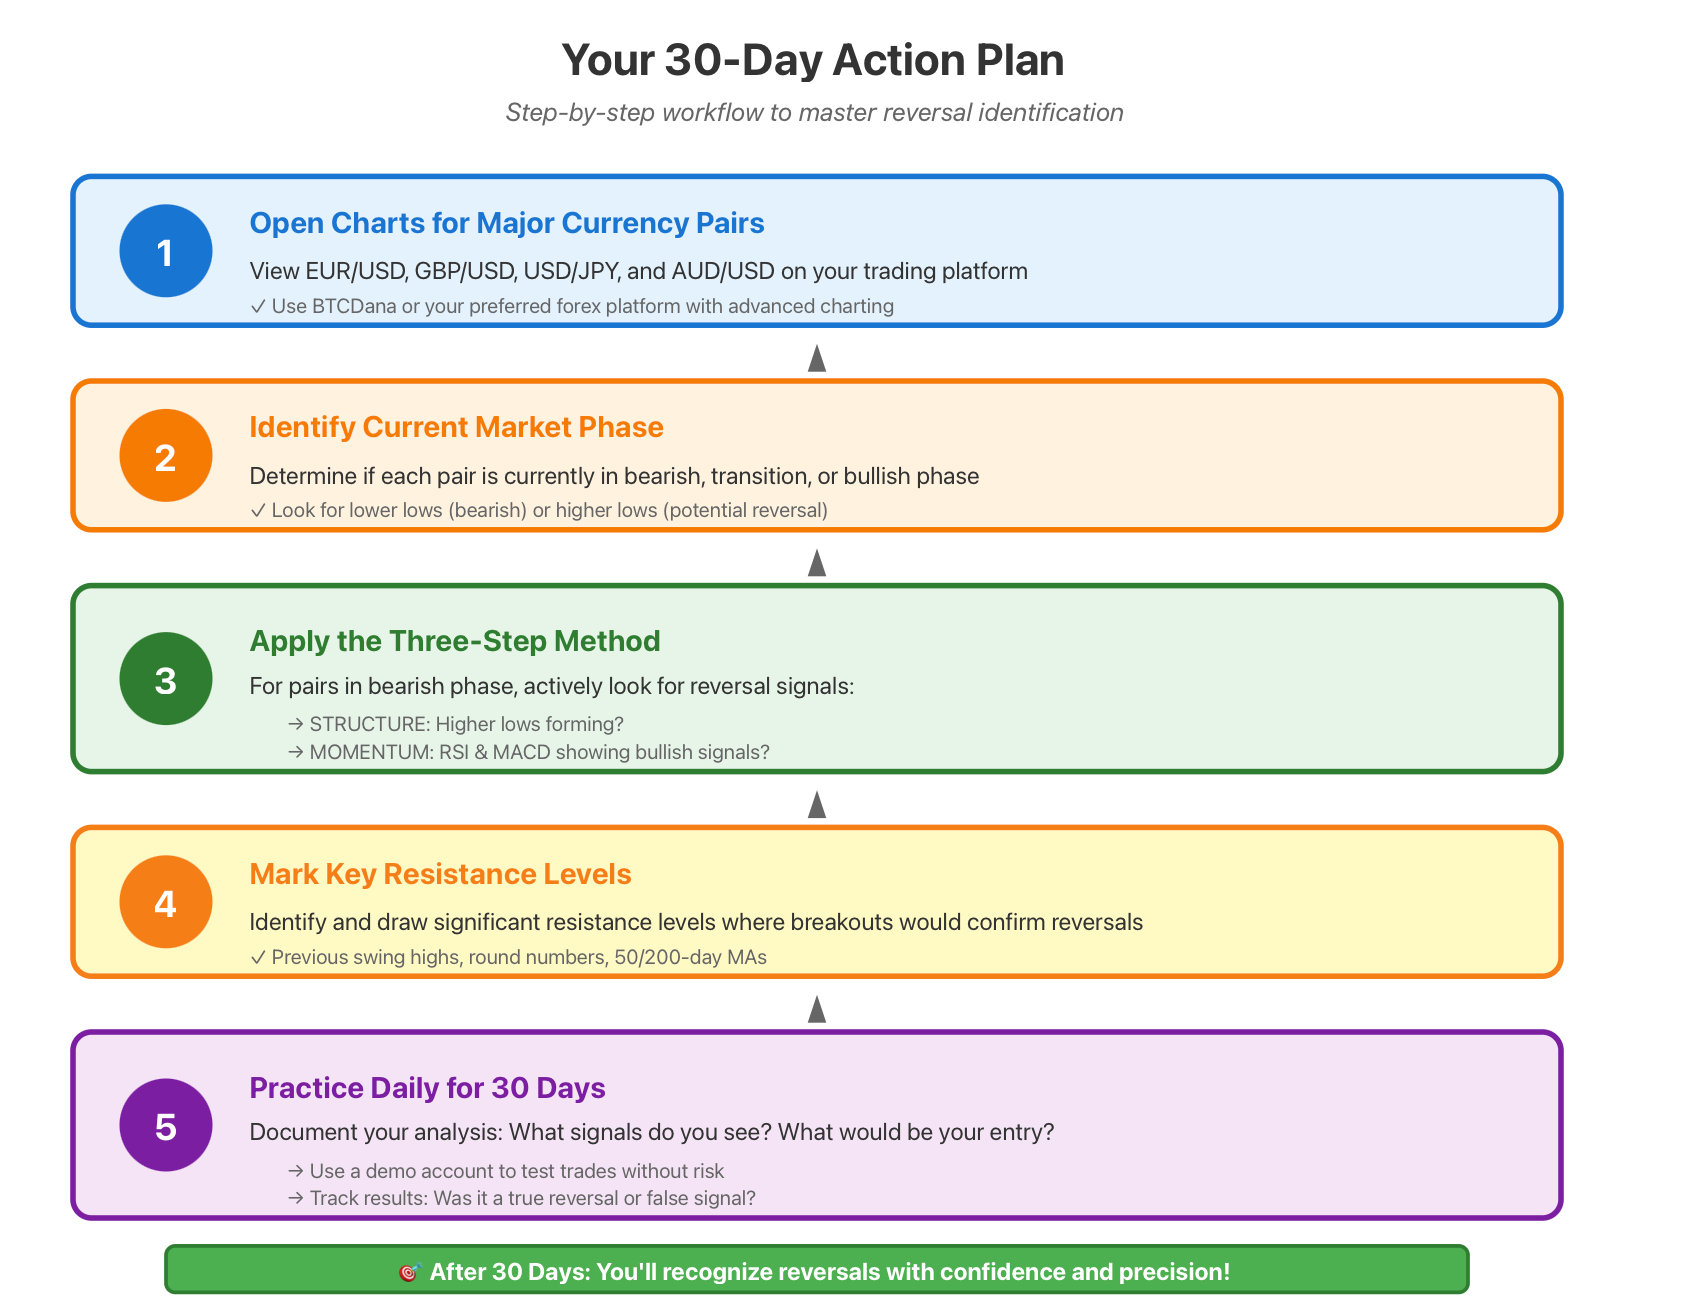
Here is your next course of action:
-
View the charts for major currency pairs such as EUR/USD, GBP/USD, USD/JPY and AUD/USD.
-
Determine if the markets are currently in a bearish phase or a bullish phase.
-
If the markets are currently in a bearish phase, look for signs of higher lows forming, as well as
-
the RSI and MACD indicators for potential momentum shifts.
-
Mark the most significant resistance levels for breakouts to confirm reversals.
-
Continue practising your analysis daily for a minimum of 30 days.
If you want to be able to test your reversal strategies on real market conditions, then you need the right platform in order to do so. With BTCDana, you have the tools and resources needed for advanced charting capabilities, along with access to live data feeds and demo accounts, to properly implement what you've learned, without putting any of your own money at risk. Along with the ability to analyse multiple timeframes and technical indicators, the BTCDana platform allows you to backtest your three-step methods against historical price data.
Are you ready to gain expert-level knowledge of forex reversals? If so, create a free account with BTCDana and start utilising your three-step reversal strategy on our advanced demo platform today!