


1. Introduction
Everyone who has examined crypto charts recognizes that it is moving at rapid pace. It seems one week prices soar up like crazy and the next sky seems to be falling. Crypto is exciting and stressful because of its volatility. Nevertheless, even with all that mess there are patterns when you look. These cryptocurrency seasonality trends are referred to as traders.
Seasonality refers to the fact that the market tends to behave in a particular manner in particular months’ or quarters following major events. It does not imply that prices can be predicted to penny but it demonstrates that there is beat to all clatter.
Take Bitcoin as example. It had big rallies in last quarter of 2017 2020 and 2021. Not mere chance that demonstrates the tendency of year end to coincide with bullish trends. To make simpler analogy consider way students act when they are about to take final exams. library suddenly becomes full coffee shops become busy and activity increases. Markets act like that too. Liquidity and attention have tendency to clump together around same time e.g. end of year or immediately after halvings.
2. What is Market Seasonality?
Cryptocurrency seasonality refers to the occurrence of repetitive of price in some seasons. Consider it the calendar personality of markets.
In stocks you may hear of the January Effect where prices usually increase due to new money pumping in after end of year. The U.S dollar tends to appreciate towards the end of the year in forex as large players rebalance accounts.
Crypto is also younger and already demonstrates its cycles. The best known is the Bitcoin halving cycle. The reward that miners get is reduced by half every four years. That restricts supply and has in the past resulted in large rallies in 12 to 18 months. The other trend is year-end optimism. Price in September is usually pushed up in the last quarter by liquidity, holiday bonuses, and investor mood.
Statistics indicate that on average, the 12-month performance of Bitcoin following a halving has been more than 200 percent during the previous cycles. Beginner example. Think of the school cafeteria when exams occur. During that time sales of coffee are always high. The reason is that behavior repeats, which means it happens every year.
Even then, despite being a young trend, crypto already displays repeating patterns and cyclical changes that you can learn.
Comparison of Seasonality Patterns: Stocks vs Forex vs Bitcoin
3. Factors Driving Seasonality
Now we can ask ourselves why these seasonal trends occur. There are no magic drivers, there are real drivers.
1. Macro factors
The bigger economy matters. Risky assets such as crypto tend to increase when central banks reduce interest rates globally and inject money into the markets. Cryptocurrency tends to suffer when interest rates increase and money becomes tight. In 2020 rates were close to zero and governments provided stimulus. Bitcoin and other currencies went on a boom. In 2022 rates soared and crypto went deep into a bear market.
2. Industry events
The traditional one is that of Bitcoin halving. Temporary cycles were also generated by Ethereum upgrades such as the London hard fork or the Merge. Traders also react to regulatory news including new approvals or crackdowns.
3. Liquidity flows
Year-end institutions reprice portfolios. The selling and buying around December can also be triggered by tax reasons. Retail investors occasionally invest end-of-year bonuses or open new positions in January. All of this pushes prices.
4. Investor sentiment
Memes, optimism and even holidays do count. The market has moods. The month of October has come to be known as Uptober since Bitcoin tends to pick up around that time. People tend to be less risk-averse during festive seasons.
5. Professional example
A 2020 Bitcoin halving and global stimulus resulted in the ideal environment to reach highs. Beginner example. Imagine cinemas at Christmas. Fewer people, poor mood, fewer tickets sold.
4. Methods to Forecast Crypto Seasonality
Some moves are unpredictable but with the help of a couple of forecasting techniques, you can increase your chance of success.
1. Crypto Historical data analysis
Look at the performance of Bitcoin in the past years by month and quarter. As an example, Q4 has been the most powerful quarter. September has been a poor month. You can map these averages and take them as a reference point.
2. Timed technical indicators
Combine RSI, MACD and moving averages with seasonality. When you know that Q4 is typically good, and RSI goes up, then you have more confidence. When a good season is beginning and RSI has already become overbought, then you may anticipate a correction before long.
3. On-chain metrics
Cryptocurrency is special as you may view blockchain information. The increase in the number of active addresses, the volume of transactions, the number of coins transferred off exchanges, and the amount of coins held by miners are all indicators of whether people are hoarding or spending. These indicators tend to be in step with seasons.
4. Sentiment and capital flows
Monitor Google search traffic, social media buzz and stablecoin flows. When interest is running high in October, and history tells us it is a bullish month, then the chances are better.
In January 2021 Bitcoin reached new highs with institutions coming in, yet RSI was screaming overbought. A correction followed. Beginner example. Weather forecasting. You see snow is a characteristic of winter. Then you look at the clouds today to find out whether it will snow now.
5. Case Study: BTC and ETH Seasonality
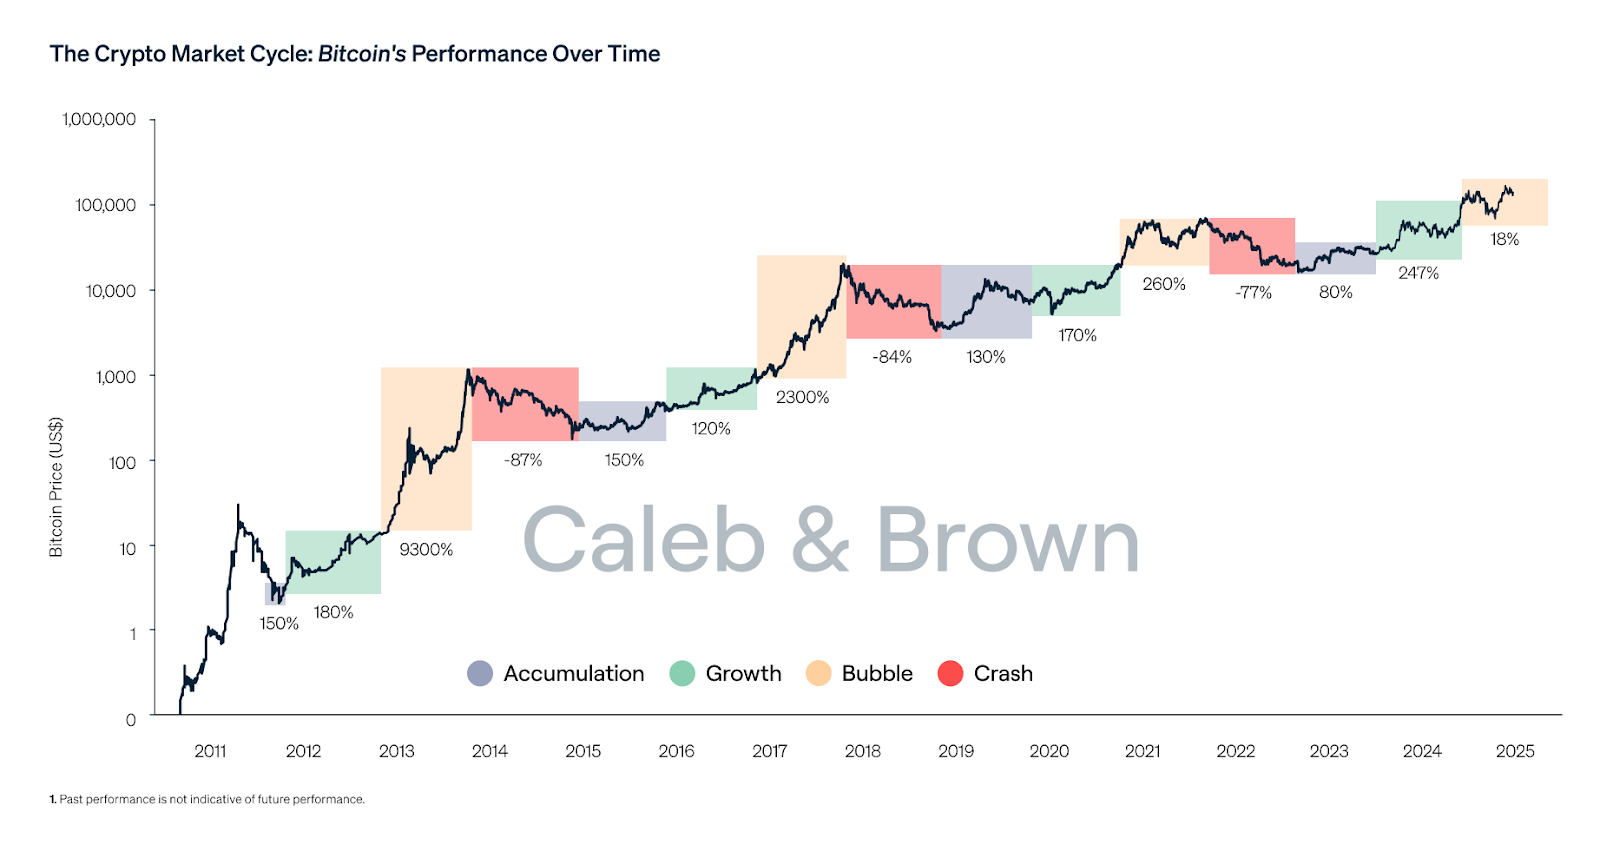
Bitcoin has the most obvious seasonality. Each halving has established a huge bull run.
-
Following the halving in 2012, the Bitcoin price increased by more than 1,000 in the following year, starting at approximately 12 dollars.
-
Following a reduction in the 2016 halving, it increased between approximately 600 and close to 20,000 in late 2017.
-
Following the 2020 halving, it rose between 9,000 and almost 69,000 in late 2021.
-
Notice the pattern. Large rallies in 12 to 18 months, usually topping in Q4.
Ether is different yet cycles are present. ETH will usually trend when large upgrades are near. The 2021 London upgrade and the 2022 Merge both triggered a run. ETH also performs well when there are altcoin seasons, which tend to take place after Bitcoin calms down. A case in point, in April 2021, Bitcoin hit an all-time high and Ethereum followed a month later as traders shifted to altcoins.
Bitcoin historical trend increased by 6 times in 18 months following the 2020 halving. Beginner example. Bookstores get a rush every semester when new textbooks come in. That rush is predictable.
BTC vs ETH Historical Cycles and Seasonality
6. Risks and Common Mistakes
Seasonality is not a magic trick but it is useful. Here are the crypto risks to avoid. Believing it is guaranteed. Simply because Q4 is generally bullish does not mean that this Q4 will be. Patterns add to probability, but not certainty.
1. Forgetting black swans
Large shocks have the power to cancel seasonality. The market can turn on its head with a hack, regulatory ban, or an unexpected crisis in the economy, regardless of what history tells.
2. Poor risk control
It is dangerous to use high leverage or omit stop losses on the basis that a certain time of the year is usually good. Bitcoin tends to have 30 to 50 percent corrections even in bull markets.
2022 was expected to be bullish in the cycle, but aggressive interest rate hikes crushed the market. Beginner example. Summer is usually hot, but sometimes a cold front hits.
Best practices. Diversify. Use stop losses. Scale into positions instead of going all in. Keep up with news. Always accept that “this time might be different.”

7. Practical Strategy: How to Take Advantage of Seasonal Trends
Seasonality can be used by various kinds of traders in different ways.
Long-term investors. Use the halving cycle as a map. Load up in the year of or immediately after a halving, and then arrange to make a profit the following year and a half when history records high bull runs. Average dollar cost in weak months to accumulate at superior prices.
Short-term traders. Trade in season. When October is a generally good month, seek long structures where charts validate. When September is weak and frequent, then tighten risk and prepare to fall. During holiday periods, liquidity is thinner, and the swings can be sudden. The event-driven trades also work. As an example, purchasing ETH several weeks before a major upgrade and selling during the hype.
Beginners. Start small. Follow monthly and quarterly trends. Attempt small stop-loss positions. Write down what you observe. First, look at BTC and ETH where the market cycle trading are better developed. Consider it as holiday sales in shopping malls. They come every year you know, but you still research prices and remain within your budget.
A lot of institutions have been squirrelling away after a halving, and squirrelling away into the next bull market. Beginner example. To learn to test the waters with a small trade on a holiday rally. Key point. Punishment is better than prognostication. Seasonality: use as a map, not as a promise.
8. Conclusion
Cycles in crypto give us the sense that it might seem like the market is wild, but it is not random. There are patterns. Bitcoin halving cycles, end-of-year rallies, and Ethereum upgrades all provide hints as to when markets may be more active and more bullish.
However, the fact that such cycles are known does not guarantee profitability. The most effective method is to integrate past trends and present indicators and to control risk at all times. Crypto seasonality is best considered a guide and not a prophecy.
If you want to put these lessons into practice and use tools to follow the market, check out btcdana.com. Learn, plan and stay disciplined. That is how you turn patterns into progress.