


Introduction: The Power of Trend-Based Fibonacci Extensions in Forex Trading
Have you ever noticed how some price levels behave like magnets in the Forex market? The possible explanation for this phenomenon involves a mathematical sequence called the Fibonacci sequence that has been around for more than 800 years. The Fibonacci sequence is simply a series of numbers in which each number is formed by adding the two previous numbers together (0, 1, 1, 2, 3, 5, 8, 13…).
This same pattern can also be found in multiple places in nature, including spiral galaxies and sunflower seeds. However, what makes this pattern unique is that it is also seen in financial markets and has proven to be a reliable way of predicting future trends based on the Fibonacci ratios.
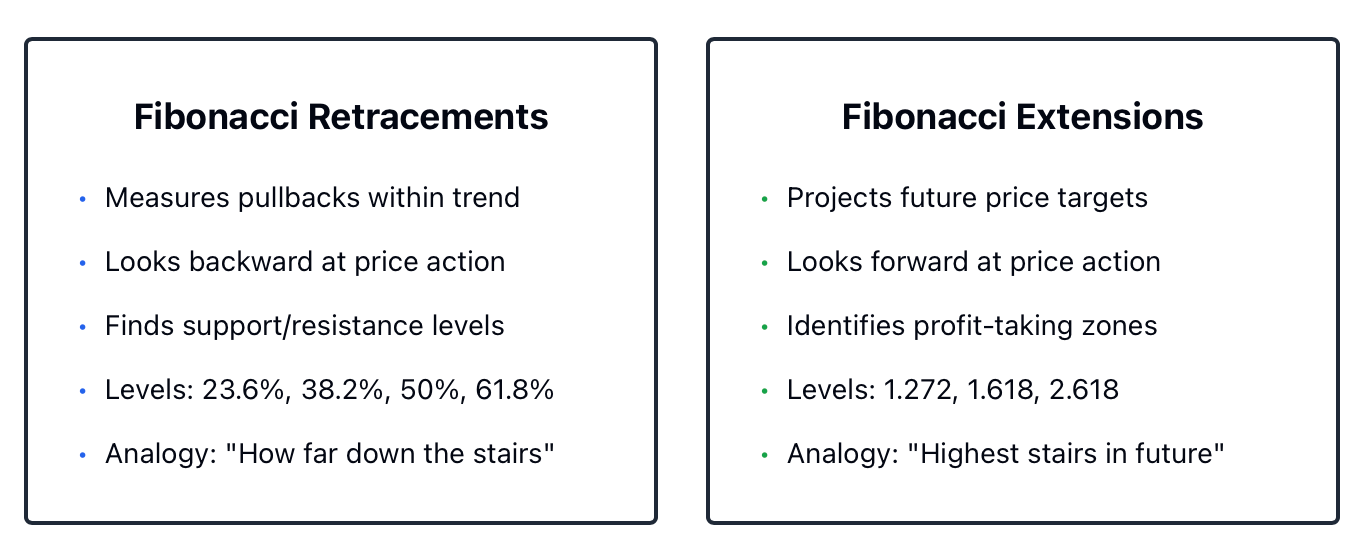
Many traders understand how to use Fibonacci retracement levels to find support and resistance levels for a trend, but trend-based Fibonacci levels are a completely different approach to analysing the market. Trend-Based Fibonacci analysis focuses on projecting future price targets and profit areas by using the current trend rather than looking at past price action to determine where those levels will occur.
Walk up stairs to understand Fibonacci extensions and retracements; for example, as you go up, Fibonacci extensions would be the highest stairs in the future, labelled with the measurement of distance you would come back down, but with Fibonacci retracements, you can directly see how far back you can come down.
The way stock and Forex traders apply these Fibonacci extensions to create target zones for profit is phenomenal. As Wall Street traders and Forex traders saw the rise of EUR/USD in 2023, they were able to accurately predict price targets at 1.618 and 2.618 within a day, and the price hit these targets on many occasions.
The main advantage of using trend-based Fibonacci extensions is that the levels indicated by that method are based on the collective bias aggregate view of thousands of traders globally that things will hit those same levels.
Core Principles of Trend-Based Fibonacci Extensions
In terms of Fibonacci numbers, several different ratios are also very important for measuring extents, including: 0.618,1.272, 1.618, and, in some cases, even up to 2.618. The values for these ratios were calculated by dividing and multiplying Fibonacci sequence numbers in various ways, and were quite consistent in predicting trend targets.
The reason these levels work is that the behaviour of the market is not an accident, but rather it is largely based on the psychology of traders. As soon as a price trend begins to move, traders take profits at predictable intervals. Early buyers realise their profits, new buyers invest their money into the trend, and so on. The buy/sell action associated with these initial investments usually happens in waves, and so these waves are often related to Fibonacci ratios, because there are so many traders watching, these become reference points.
The way in which Fibonacci numbers relate to trends in the Forex Market is the "triple-point plotting principle". To determine true extensions, you need to establish three points:
-
The Start of the Trend: Where did the price movement begin?
-
The Extreme of the Trend: What is the highest or lowest price in that trend?
-
The Retracement Level: At what level did the price pull back and then re-establish itself?
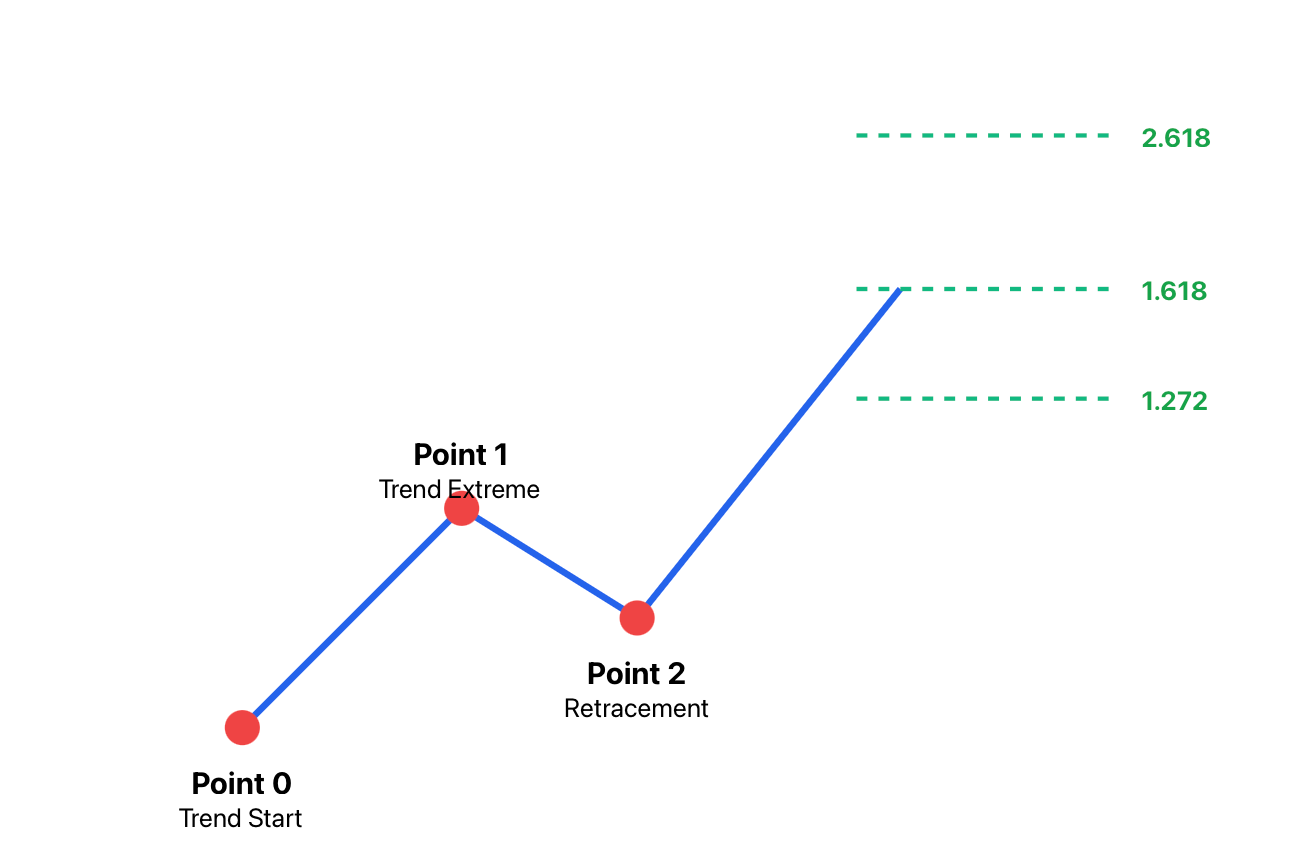
After working with the trading platform, you will identify three points to project Point 3. An example would be to envision a spring slightly compressed before being released. The point of initial contact with the spring would equal Point 0, Point 1 would show full compression, Point 2 would be when the spring is partially released, and Points 3 (1.272, 1.618, and 2.618) indicate how far it could potentially bounce. If we take the example of the AUD/USD pair when in a solid uptrend and identify your three points, then you would focus primarily on your 1.618 extension level.
Many times, professional traders will have the experience of prices bouncing or pausing at these levels with surprising precision, so they lose some time in their trading at these levels of forecasted targets.
Using the mathematics of the Golden Ratio in conjunction with the plotting of the Tri-Point system helps create a very elegant yet effective mathematical and practical framework in which to trade. It is not an exercise in fortune-telling; instead, it is about recognising how traders respond collectively to significant price areas.
Step-by-Step Triple-Point Plotting Guide
Would you like to practice trend-based Fibonacci numbers by plotting them on your charts for Forex Extensions? Plotting extension levels onto charts isn't difficult; what you need to do is make sure that you have the right three points. Once these three points are established, the reliability of your projections will greatly increase.
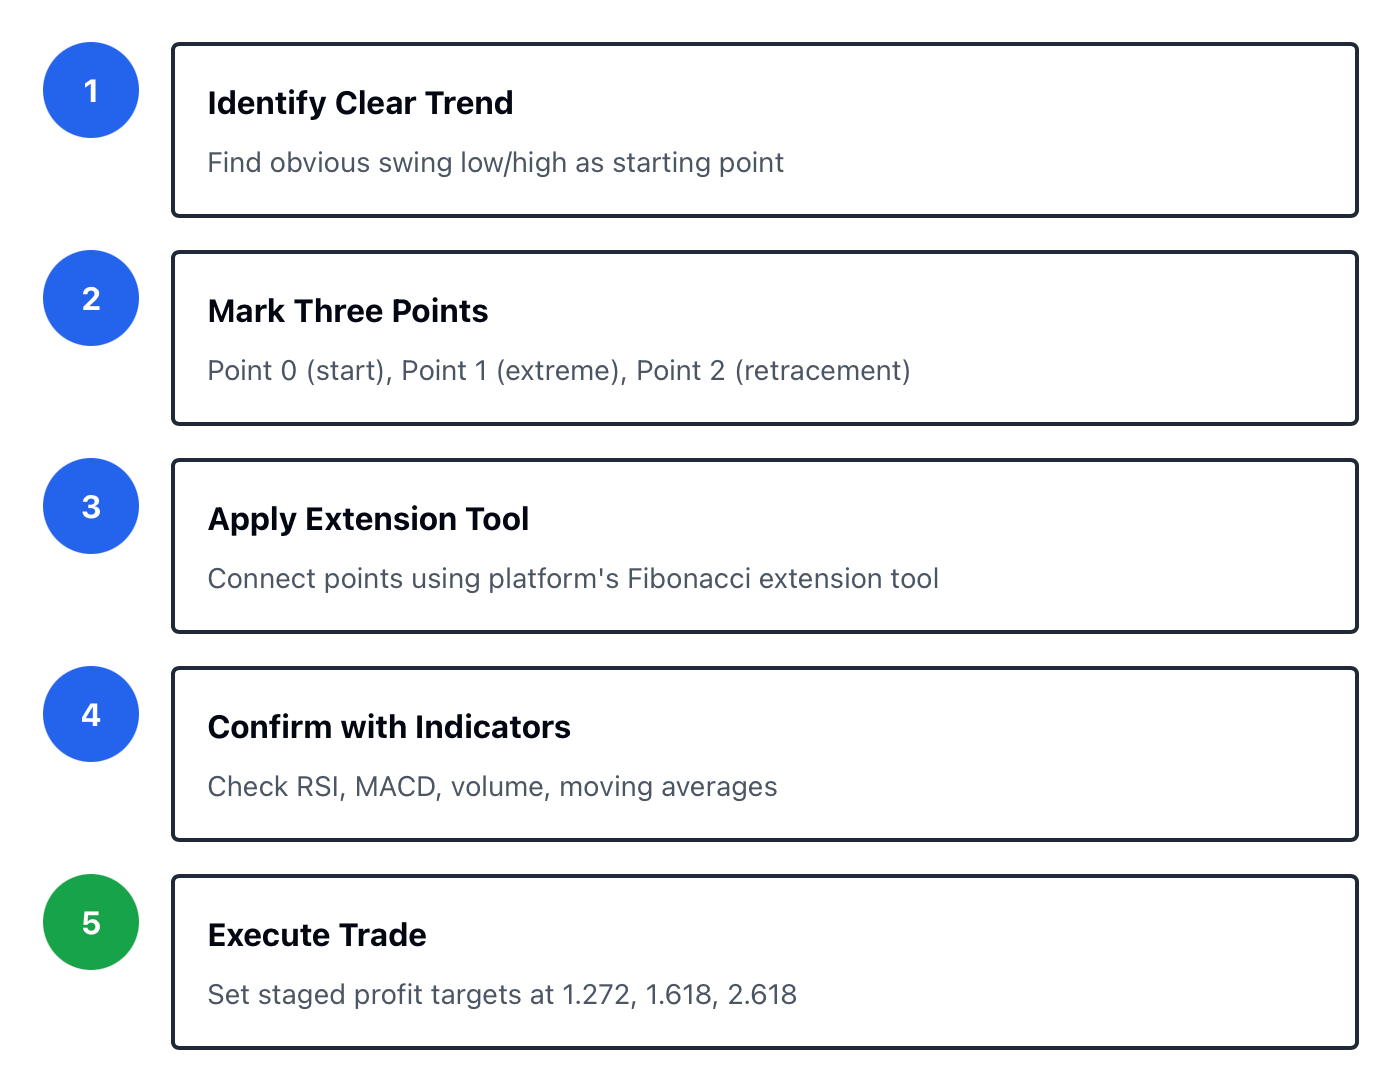
Step 1: Choose a Clear Trend Starting Point (Point 0)
The easiest way to find this point is to identify a swing low on an upward movement or a swing high on a downward movement. The starting point of the trend must be defined by a solid reversal where there is a definitive change in the price's direction. If you can, take a step back from your current view of your chart to see if you can find a more obvious trend starting point. The more obvious you can identify your starting point, the greater your success will be when determining your extension levels.
Step 2: Identify the Trend Extreme (Point 1)
This is typically the highest price from the beginning of your upward movement (i.e., the top of your Upward price) or the lowest price from the start of your downward movement (i.e., the bottom of your Downward price). The extreme point of the trend reflects the point of greatest momentum before all the traders have started to take profits on the upward price movement. In a strong bullish trend, the extreme point may represent the convincing high just before the significant profit-taking during the corrective phase of the upward price movement.
Step 3: Select the Retracement Point (Point 2)
In this step, we’re identifying where the price pulled back after reaching Point 1. The retracement is an important part of determining how to project future extensions because it tells us where the price paused before continuing in the same direction. Find the place where the pullback ended and the price returned to its upward trend. This may coincide with a support area, a trendline, or a Fibonacci retracement level (the most common levels are 38.2% or 50%). Your retracement point will be used as a point of reference for your prediction of how far prices will extend.
Step 4: Draw the Extension Line and Mark Key Levels
Connect all of your three points with an extension tool on your trading software (e.g., MT4, MT5 or TradingView). Most trading software has built-in tools that automatically generate extension levels for you at 1.272, 1.618, and 2.618. Identified extension levels are potential targets for future prices.
If you would like to visualise an easier way to see these examples, think about it as climbing a stair-step series where each stair or step gets taller and taller. You started at the base (Point 0), climbed to the first step (Point 1) and then stepped back down a few (Point 2) and now you are predicting how high your next step will go (the next landing). Extension levels of 1.272 are your next landing, and the 1.618 is the next upper level.
A specific example of this is USD/JPY being in an uptrend. Let's refer to Point 0 back at 148.50, with Point 1 moving to 151.20, and Point 2 pulling back to 149.80. The Extension Tool projects potential targets of 152.00 (1.272 Extended), 153.50 (1.618 Extended) and 156.00 (2.618 Extended). These represent your Profit Target Zones.
Please remember that this technique is only applicable to well-defined, strongly trending markets. The use of Fibonacci Extensions will not be accurate in a choppy, Sideways Market. If you find yourself squinting at your Charts trying to identify a trend, then there likely is not one. You should wait for clarification of the Trend before using this Technique.
Confirming Trend Extensions with Technical Indicators (RSI, MACD, Moving Averages)
The Fibonacci extensions are an extremely useful tool for predicting future price action. They provide invaluable assistance; however, using Fibonacci extensions alone to determine potential price levels may produce incorrect conclusions, just like attempting to drive using only one eye. Thus, it is important that, in addition to Fibonacci extensions, other tools and indicators are employed to confirm your Fibonacci extension results, thereby increasing the odds of attaining an accurate outcome. Using Fibonacci extensions on Forex pairs works best when combined with other technical indicators that indicate the same or similar price action.
Momentum Indicators: The RSI & The MACD
Momentum indicators like the RSI and MACD are very useful in determining whether there is enough momentum for the current trend to continue or whether a change may occur. When the Fibonacci extension target indicates a price level of 1.618 and the RSI provides a cautionary sign because of bearish divergence, as indicated by higher highs of price and lower highs of the RSI, this should cause you to re-evaluate your chances of success when using a Fibonacci extension.
If you think that EUR/USD is headed toward a 1.618 extension target and that your MACD has just formed a bullish crossover with the MACD line located above the signal line while also generating more histogram bars than previously produced, you will likely achieve your Fibonacci extension target in the direction of the previous trend. To understand the importance of momentum indicators, think of them as the speedometer in your vehicle.
If you are estimating that you will arrive at a specific destination and your speedometer shows a decrease in speed from what you had calculated earlier, indicating a reduced probability of reaching that target, then your chances of arrival at that destination have decreased significantly.
Moving Averages: Trend Confirmation and Retracement Endpoints
Moving averages serve as a tool for determining when a retracement has ended and the trend resumes. A typical strategy would be to use both a 50-period moving average and a 200-period moving average. When the price pulls back to Point 2, bounces off the 50MA and then continues upwards through the upward trajectory of the moving averages, the Fibonacci extension projection will be a better indicator of where the pair will end up.
Let’s take a look at this in real terms using the EUR/USD example. The pair was in a bullish trend with Points 0, 1, and 2 clearly defined in the chart layout. The Fibonacci extension projected a target price of 1.1850 based on a 1.618 extension level. However, before taking the trade:
1. Check the Relative Strength Index (RSI) to see if RSI is above 50 and rising; if so, odds are good for continuation.
2. Check the Moving Average Convergence Divergence (MACD) to ensure MACD issuance through crossing above/below zero with a wide expanding histogram will also add confirmation.
3. Check 50 MA, the price came off the 50MA, so this was an occurrence of a major pullback over time.
Once these indicators line up, the 1.618 extension has a much higher level of confidence associated, versus just using Fibonacci levels alone. Professional traders typically will not consider Fibonacci extension targets without having some level of consensus to act upon.
The difference is basically calculating the odds of the trend moving higher or lower. Therefore, the important conclusion is that Fibonacci extension levels provide a price target, and all of these other indicators provide sufficient strength or validity to indicate whether or not they have sufficient momentum to reach those levels; by using both methods together, your results can be greatly improved.
Multi-Timeframe Analysis: Combining Short-Term and Long-Term Fibonacci Extensions
Ready To Take Your Forex Trading To The Next Level? Quit Relying On One Time Period! Forex Traders Who Focus On Multiple Time Periods Yield The Most Profits. In Forex, Traders Who Use Trend-Based Fibonacci Numbers Use An Analysis Of Multiple Time Periods To Align The Entire Trend On Multiple Time Frames.
The Long-Term/Short-Term Dynamic
The Long-Term Trend Is Defined By The Daily And Weekly Chart. These Longer-Term Charts Show The Overall Direction Of The Trend And Current Major Extension Targets. Therefore, Long-Term Charts Have The Most Value As They Represent The Strategic Areas Where The Trend Should End. On The Other Hand, There Are Short-Term Charts (1-Hour And 4-Hour), Which Provides Tactical Aspects, Such As Where You Will Enter, Short-Term Pullbacks, And Temporary Resistance Points.
The Daily Chart For The Currency Pair USD/JPY Is Showing A Strong Uptrend With A Target At 154.50 Or 1.618. This Is Your Ultimate Target To Reach. However, When You Switch To The 1-Hour Chart, You Will Find This Currency Pair Has Entered A Minor Pullback, Approaching The 0.618 Retracement Point Of The Last Swing High. These Two Time Periods Are Connected. You Would Enter Your Trade And Ride The Pullback And Continue Towards The Daily Target Of 154.50.
View it as a climbing experience. The long-term view displays the peak (the end goal of your Fibonacci level). The short-term view shows the path taken, where the upcoming switchback is, and where there is an opportunity to take a break. Both perspectives are required for success. A climber cannot expect to summit by only referencing the next 100 feet, nor can they expect to reach the top knowing where the summit is today with no understanding of the steps to get there.
Practical Usage: The Daily/Hourly Connections
When approaching a trend, you must always begin at the daily time frame by identifying a defining trend and marking off points 0, 1, and 2. You need to have identified the primary extensions that you will be targeting for maximum profit at 1.272, 1.618, and possibly 2.618. These are your primary profit levels; you don't negotiate these levels.
Next, go down to the 4-hour or 1-hour time frame. Within the confines of the daily trend, you will see smaller trends creating much smaller retracements. Likewise, identify Fibonacci extensions for these smaller trends as well, as they will help you determine levels that may create minor resistance zones before the price reaches your daily level.
Real Example: USD/JPY Multi-Timeframe Analysis
Your daily chart plots 0 at 148.00, 1 at 152.50 & 2 at 150.00 (daily extension at 1.618 target of 155.20). The hourly chart shows a micro-uptrend/Extension targeting 153.00, which sits between your point 2 and the final daily target. The plan is to get in on hourly pullbacks to grab some profit at 153.00 (hourly extension) and keep your remaining position towards 155.20 (daily extension).
You're looking to avoid common mistakes like either entering too early, e.g., looking good based on daily charts while discovering immediate hourly resistance, or missing opportunities, e.g., waiting for a perfect daily setup with the hourly providing numerous viable trade entries.
Using the Fibonacci extensions along with multi-timeframe analysis will give you much greater clarity in finding better times to buy, as opposed to, say, relying solely on one timeframe, and the extensions will help keep your ultimate attainment front and centre.
Using Trend-Based Fibonacci Extensions in Trading Decisions
Instead of just telling you about theory, let's get down to the brass tacks and talk business. How can you put trend-based Fibonacci numbers, meaning forex extensions, to use so that they create actionable strategies that directly impact the amount of money in your account? That's where the transition from "mathematical projections" to "actionable trading strategies" happens.
Setting Target Prices: The Extension Ladder
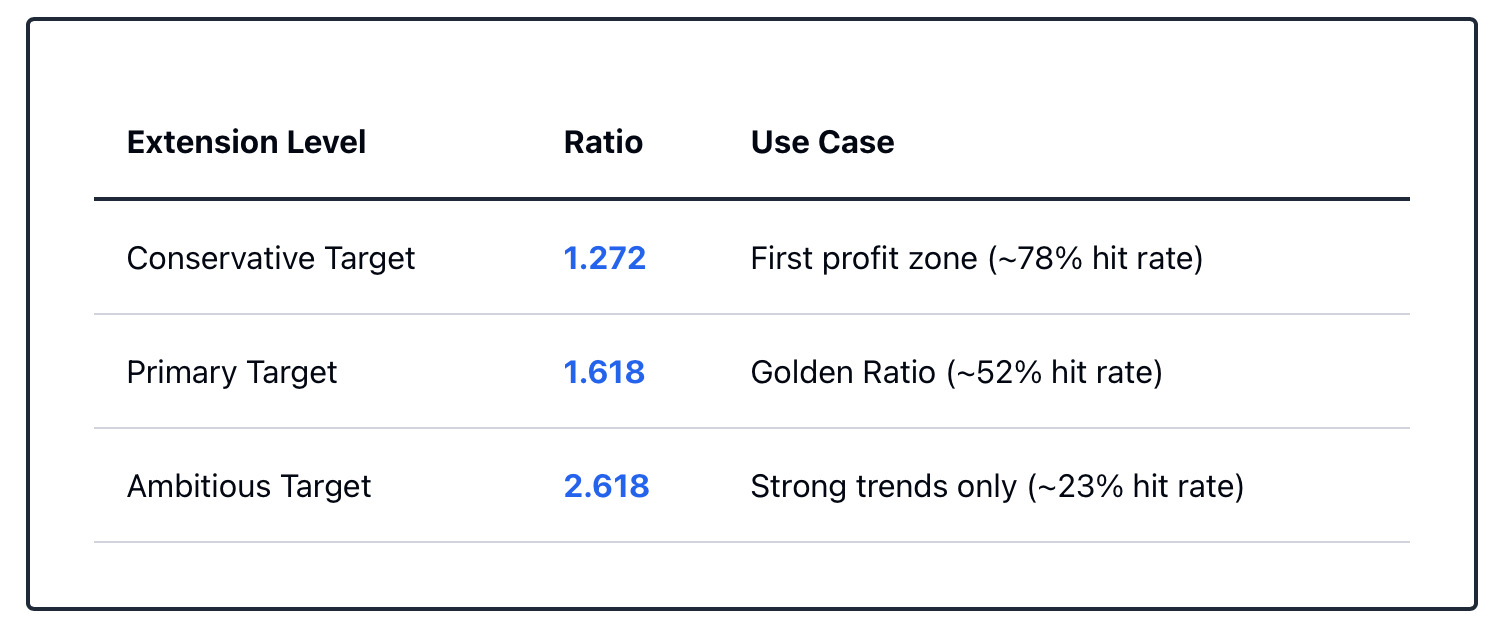
Your Fibonacci Extension Levels create a built-in "ladder" of profit targets for you. The 1.272 Level should be used as a conservative target (the probability of most trending extension finishing here). The 1.618 Level serves as your primary target where you should expect to find most of your trades. Historically, this Golden Ratio has been a point of strong resistance and the end of a trending move. The 2.618 Level is considered ambitious and would require an extremely strong trend. Do not choose only one of these target levels. You should choose all three to create a comprehensive strategy.
Staged Profit-Taking: The Professional Approach
Here's how professionals handle it with EUR/USD: You enter a long position after identifying a clear extension setup. Your total position is 3 lots. Instead of hoping price hits your highest target and risking a full reversal, you take profits in stages:
-
Exit 1 lot at the 1.272 extension (1.1750)
-
Exit 1 lot at the 1.618 extension (1.1820)
-
Let the final lot run toward 2.618 extension (1.1950) with a trailing stop
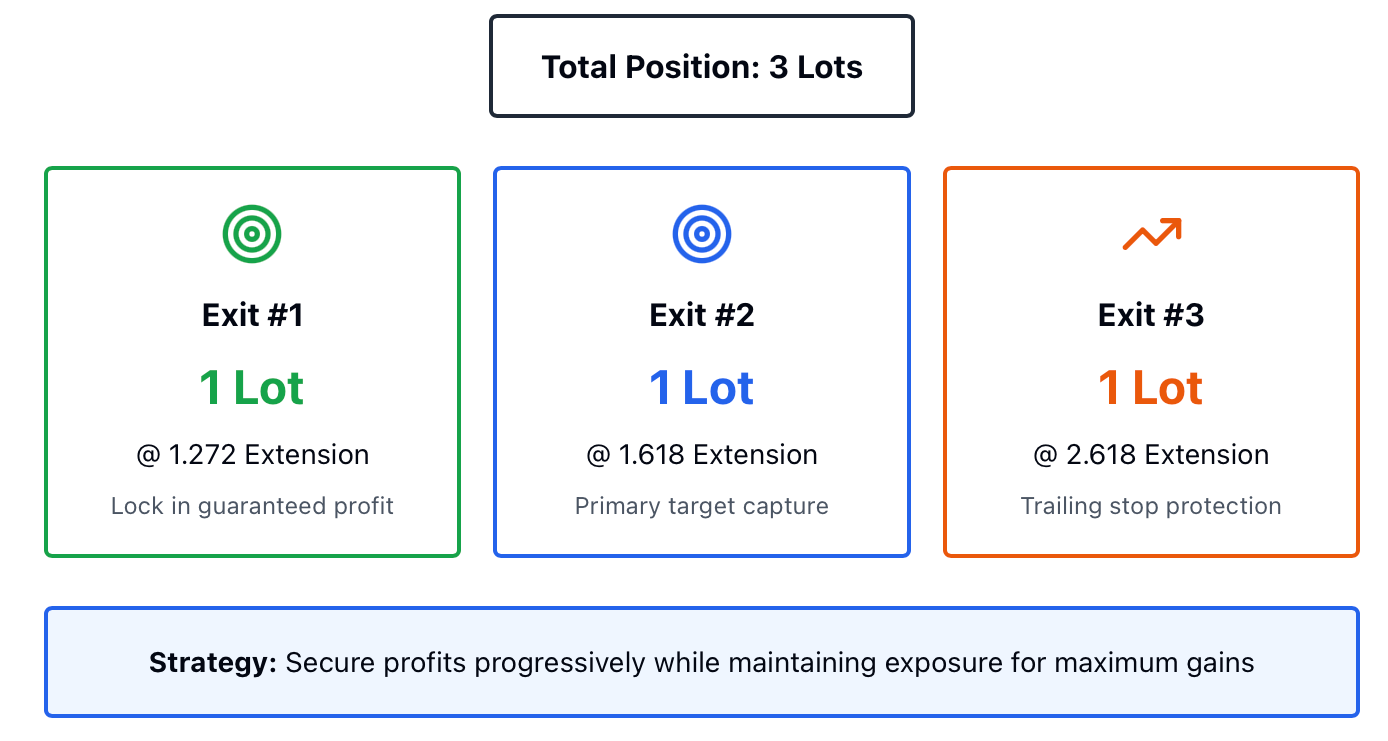
This approach locks in profits along the way while keeping exposure for the full move if it materialises. You're guaranteed to capture something even if the trend exhausts early, but you're still positioned for the home run.
Entry Strategies: Timing Your Entrance
When trading with extensions, two possible entry methods are available:
1. The Pullback Entry method allows the trader to wait for a retracement to the trend line, moving average, or Fibonacci level of importance close to Point 2. By doing this, the trader obtains a better risk/reward ratio as they will be purchasing legitimately, buying the dip while still in an uptrend, as opposed to trying to catch the momentum.
2. The Breakout Entry method, where the trader waits for the price to break above Point 1 (the previous high) before entering with volume confirmation. Once the price breaks above the previous high, then the trend has resumed, and the trader can look at extension levels as potential targets.
A beginner's analogy:
Imagine that you are a student who has studied the test scores of others and predicts that you will achieve a 95% on your next exam (your 1.618 extension target). But, to achieve that score, you do not simply "hope." You will put together a plan to study specific chapters and set milestone goals for practice tests, staged targets at 1.272 and 1.618, to continually adjust your study plan as practice test scores come in below your goals indicator confirmation. While your prediction will provide direction to your preparation efforts, what will determine whether you actually achieve the score you predicted is the effort and strategy you put into preparing for it.
The Strategic Framework
Fibonacci extensions are prediction tools AND strategic references. They tell you:
-
Where to aim (price targets)
-
When to take chips off the table (staged exits)
-
How to measure trade progress (is the price respecting the levels?)
-
When to abandon the trade (if price fails before reaching even 1.272)
The best traders treat extensions as a roadmap, not a guarantee. They plan their trades around these levels while remaining flexible enough to adjust if market conditions change. The extension levels give structure to decisions that otherwise feel like guesswork.
Avoiding Common Mistakes and False Signals with Fibonacci Extensions
Let's look at what causes errors when using Fibonacci trend-based extension numbers, as this will allow us to learn most effectively. All traders, regardless of their experience level, will make mistakes with trend-based Fibonacci extensions if they forget the 3 fundamental Principles. The following are a few of the 'landmines' to watch out for and avoid:
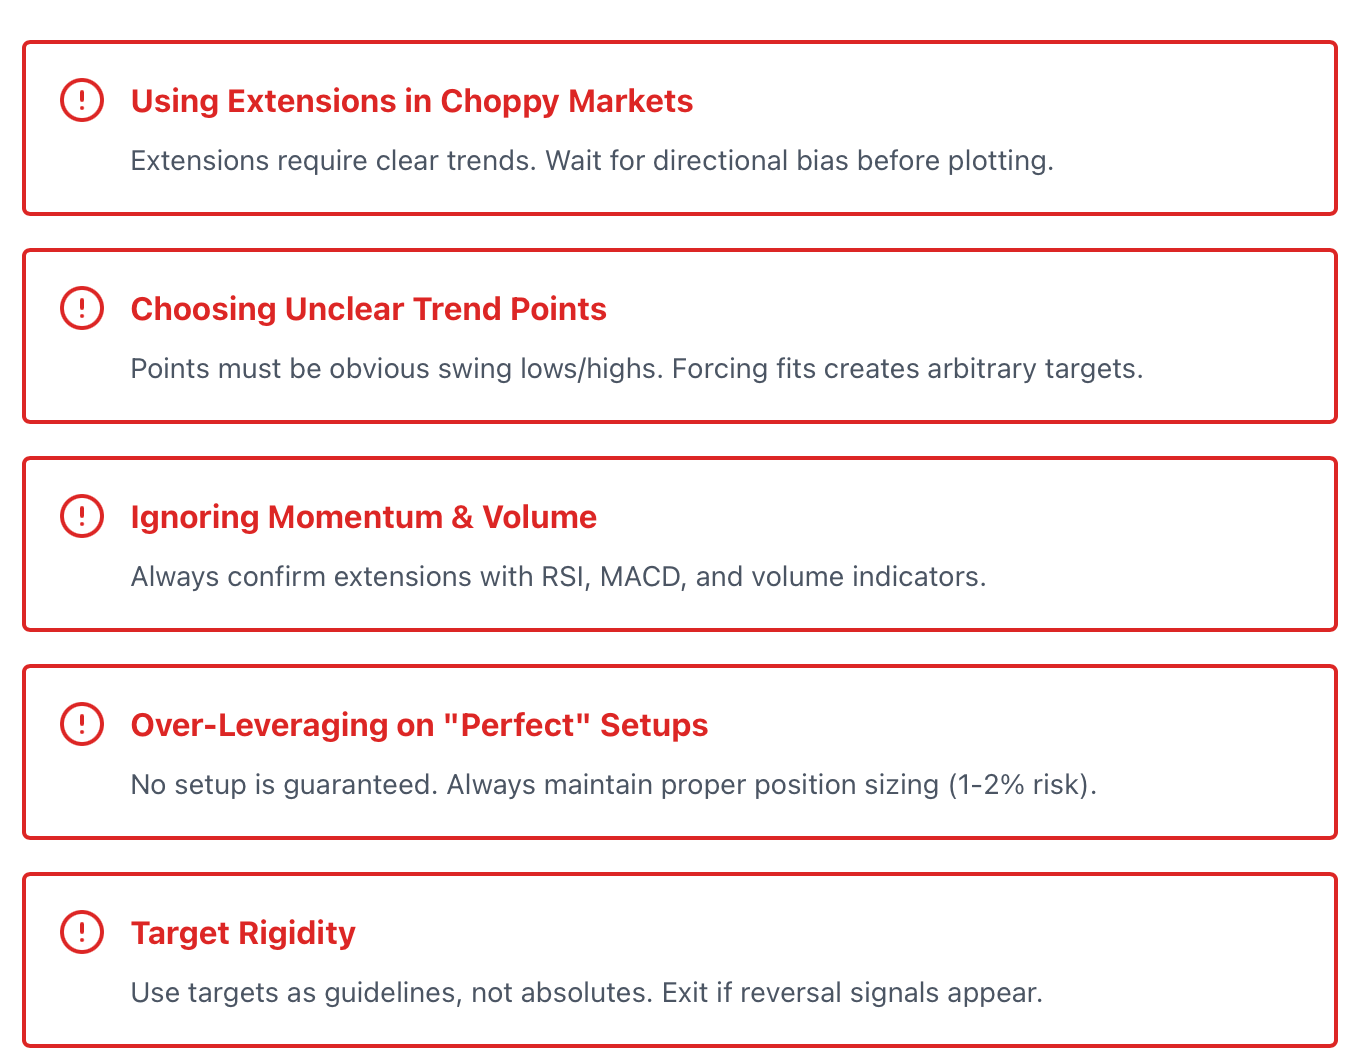
Mistake 1: Using Extension levels in choppy market conditions
Using Fibonacci extension strategies is one of the biggest mistakes you can make. In order for price action to be effective with Fibonacci levels, there must be an established and clear trend. In a 'choppy' market that is directionally flat, the 'triple-point plotting' means nothing. You will be able to identify what appears to be Points 0, 1, and 2 on your charts, plot your extensions, and watch the price action ignore your Fibonacci extension projections!
How do you identify when you're in a choppy market? The price action continues to make to equal highs and equal lows with no directional bias (price movement either way). The moving average 'lines' are flat and/or intertwined with each other. If you are having a difficult time determining whether you are in an uptrend or a downtrend, you are likely in a choppy market. Wait until the market is clearly trending before using Fibonacci extensions as a valid trading strategy.
Mistake 2: Choosing Unclear Trend Points
Three Factors must be clear as crystal, just like when charting in timeframes smaller than microseconds. If you are going to use a microscopic timeframe and simply choose Minor Swing Points to Force Fib to Fit Your Bias, then you are already barking up the wrong tree.
Point 0 should be where both traders in an Up Trend and Down Trend agree upon, and also be a distinct visible swing low/high. Point 1 should be an extreme swing high or extreme swing low, meaning very strong conclusiveness (evidence) of direction. Point 2 should be a considerable pullback of price from either of Point 1 being an extreme swing low or extreme swing high.
If your Points are Not Clear, your targets will be totally arbitrary and random, and look like a student trying to predict their next test score, using data from 3 random quizzes, not actual data; therefore, they will be discredited as having no base! That's all it takes!
Mistake 3: Not Considering Momentum and Volume Riders
Momentum & Volume confirm your Fibonacci Extensions and indicate if the target is realistic or not. A 1.618 extension might look perfect mathematically, but if:
-
Volume is declining as price approaches Point 1
-
RSI shows bearish divergence
-
MACD is weakening
-
Price is struggling to make higher highs
Then your extension target is probably not going to be reached. The trend is exhausted. Professional traders watch these signals obsessively. Amateurs just stare at the Fibonacci lines and hope.
Real Example: GBP/USD False Breakout
GBP/USD appeared to be in a strong uptrend. Traders plotted extensions projecting a 1.618 target at 1.3150. Price broke above Point 1, and extensions were activated. But here's what they missed:
-
Volume on the breakout was thin (institutional traders weren't participating)
-
RSI hit overbought territory above 80
-
A major resistance zone from the monthly charts sat at 1.3080
Price stalled at 1.3070, never reaching the 1.618 extension, and reversed sharply. Traders who relied solely on the Fibonacci extension got trapped. Those who noticed the momentum divergence and volume weakness either didn't enter or exited early.
The Confirmation Checklist
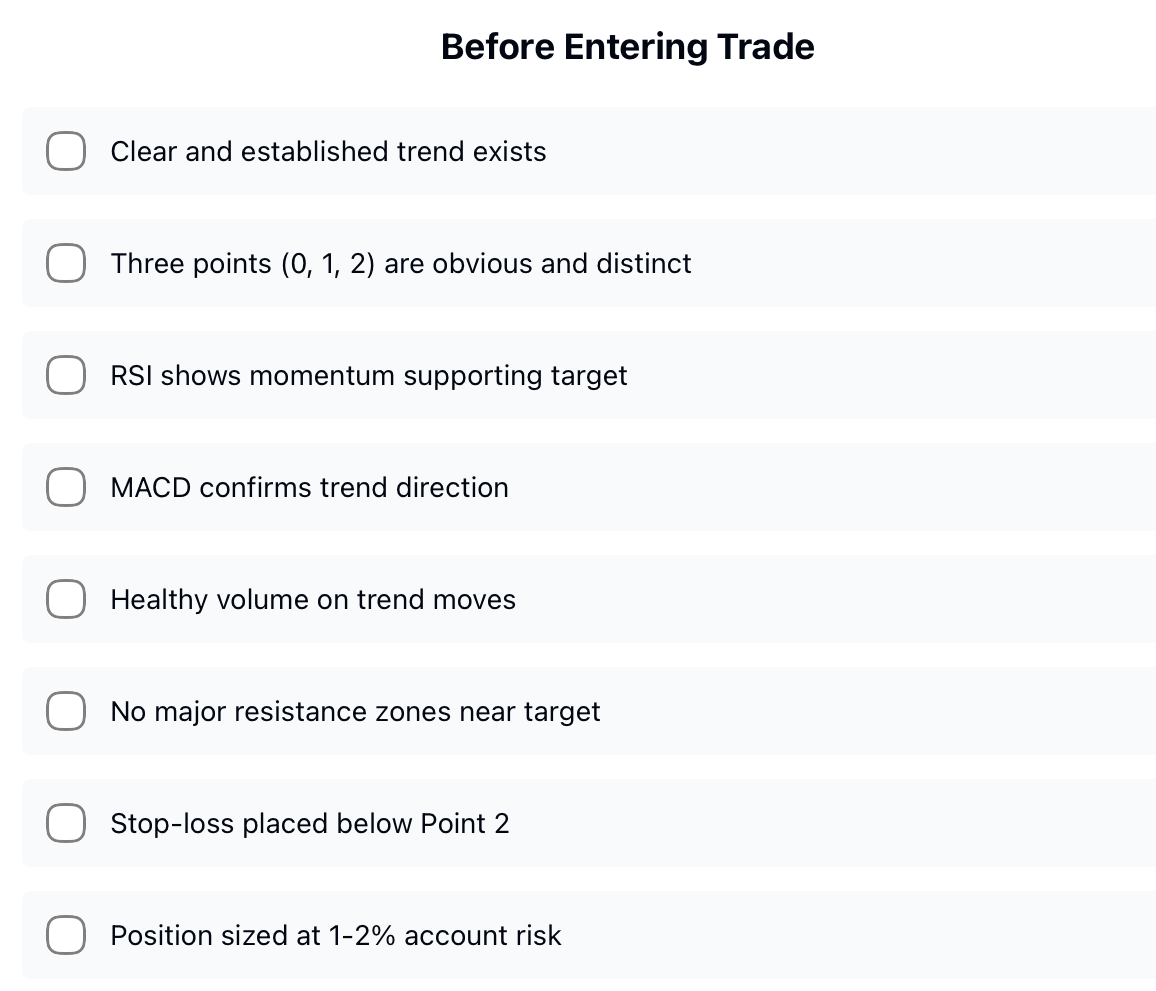
The following conditions must be met before entering a Fibonacci extension target:
-
A clear and established trend exists.
-
The momentum supports the target (all technical indicators confirm).
-
Healthy volume on moves in the direction of the trend (for institutional support).
-
There are no major support/resistance zones near the target (potential obstacles).
If you cannot check all of these boxes, it is advisable to look at any Fibonacci extension target with scepticism. There is often a fine line between successful Fibonacci traders and those who pay dearly for the lesson. The math behind Fibonacci Extensions may be correct; however, it is important to keep in mind that markets do not react the same way every time you see this math.
The way the masses have reacted to previous price levels, momentum and market structure should dictate how you approach any Fibonacci extension. Do not let yourself become one of the many traders who try to blame Fibonacci for their losses when, in fact, it was their lack of understanding of the context of the numbers that were used in creating their trade plan.
Risk and Money Management Strategies with Fibonacci Extensions
In addition to finding profit targets, it is also important to have an effective risk management strategy in place so that you do not lose out on your capital while working towards reaching those targets. You can use Fibonacci levels in forex trading to identify potential profit target areas. Utilising proper risk management strategies will allow you to remain in the market long enough to reach those profit targets.
Setting Stop-Loss Based on Extension Structure
When placing a stop loss order, make sure that you have set it according to your Fibonacci extension structure. When identifying an uptrend extension, you would generally place the stop loss below the price of Point 2 (the low of your Fibonacci extension). The reason for placing the stop loss so close to Point 2 is that if the price falls below Point 2, then that Fibonacci extension structure that you were targeting is no longer valid, meaning the structure that you were working on has broken down.
For example, if you have identified Point 2 as being 1.1650 for an uptrend extension on EUR/USD, you would look to place your stop loss at approximately 1.1630, which gives you a little wiggle room for the day-to-day fluctuations in price, and if the price breaks below that, you would exit immediately. You should not place the stop loss too close to the price of Point 2, as the daily price fluctuations may trigger your stop loss prematurely. However, you also should not set your stop loss too far away from Point 2, as this increases the amount of capital you are risking on a single trade.
Staged Take-Profit: Securing Gains Along the Way
Staged take-profit is used for two major reasons: To ensure that you will capture all profits and to capture large profits on extreme price moves. Price action is unpredictable. You develop a target based on the Fibonacci extension level of 1.618 and believe price will reach this target; however, price may tank due to an unforeseen event before reaching the target.
When using a staged take-profit strategy, you secure partial profits at the next extension level of 1.272; should the price reverse from this level, your trade will not be a total loss. If you then lock in profits again at the 1.618 level, you have likely accumulated a very nice profit whilst still keeping open a small position for the potential larger weight to build up at the 2.618 level. You can significantly reduce the psychological stress that occurs when watching open profits evaporate by taking your profits in stages.
Position Sizing: Don't Put Your Entire Life Savings at Risk
Having a beautiful Fibonacci extension set up doesn't mean that you should risk your entire account (10% of your total account) on it. The professional trader will typically only place 1-2% of his/her account balance on an individual trade if they follow proper risk management protocols. Therefore, if you follow proper position sizing guidelines, you will be able to continue trading even if your extension set-up completely fails.
To figure out your position size, you need to base it on how far away your entry price is from your stop loss. For instance, if you are entering the EUR/USD currency pair at 1.1680, with a stop loss set at 1.1630 (a distance of 50 pips), and have an account size of $10,000, willing to risk a maximum of 2% ($200), your position size calculation will allow you to determine that if you lose the 50 pips, you will take a $200 loss. This approach to calculating your position sizes mathematically removes emotion from your trading and protects your capital.
Beginner Example: The Allowance Budget
A simple example of this would be in relation to a student's allowance. When a student receives their monthly allowance, they allocate money each month strictly according to a predetermined plan. Just as they are not going to spend all of their allowance on the maybe listed above, they allocate 30% toward necessities, 40% toward their goals, 20% toward fun, and 10% for emergency expenses.
Similarly, as a trader, they would allocate their entry capital, multiple profit targets, stop-loss protection, and reserve capital for future trades with the aim of being able to take advantage of multiple trading opportunities without needing to miss the next opportunity because they overextended their budget.
Professional Example: Multi-Position Staged Management
A professional trader enters EUR/USD with three positions targeting Fibonacci extensions:
-
Position 1 (0.5 lots): Exit at 1.272 extension, stop below Point 2
-
Position 2 (0.3 lots): Exit at 1.618 extension, stop moves to breakeven after 1.272 hit
-
Position 3 (0.2 lots): Target 2.618 extension, trailing stop once 1.618 reached
This structure guarantees profit capture while maintaining exposure for the full move. The stop-loss protection evolves as the trade develops, reducing risk continuously.
The Reality Check
You should never risk your entire trading account on one predicted market behaviour based on a Fibonacci Extension. No matter how good the market setup may be at that time, anything can occur at any time to impact the outcome: Fundamentals New may come out, Central Banks can intervene with large trades before the public does, and Black Swans can happen unexpectedly. As a result, you cannot predict the unpredictable; however, what you can do is manage your risk such that the inevitable losing trades do not wipe you out and eliminate your ability to participate in the winning trades.
While Risk Management is not a very entertaining aspect of trading, it is also the biggest difference between traders being able to sustain their trading careers over time, and those who lose their entire account and stop trading within a matter of a few months. Fibonacci Extensions provide the specific targets, while Money Management allows you to remain active and continue to collect on those targets.
Trader Psychology: Avoiding Overreliance on Fibonacci Extensions
Get ready to dive into the reality of Mental Game because it is the mental aspect that causes most technically sound traders to fail! Fibonacci extensions based on Trends may be a good indicator of potential movement in the forex market, but do not give us an absolute prediction as to where the market is headed. The mental pitfalls surrounding these extensions are just as serious as the technical blunders associated with them.
Overconfidence Pitfall
You've found an ideal Fibonacci extension set-up. You are confident you've used the trend to identify your points (0,1,2) correctly. You see all your indicators confirming your Fibonacci extension levels, and your target price is located at the 1.618 level, exactly as you believed it would be. You think this is the trade of the Year! In fact, you are so confident in the potential of this trade that you increase your lot size to make a larger profit.
Suddenly, the price gets to the 1.4 level and stops. You had planned on selling/taking profit when the price hit the 1.618 level, but were unable to. Markets do not owe you anything! Every time you create what would appear to be an extremely high probability entry setup, it is a reality that it can fail. A failed trade is just the way of life with Fibonacci extensions and is normal within the forex market. Overconfidence can lead traders to over-leverage their positions and bypass confirming indications, which allows traders to see clear warning signs, but in the end can result in losing money.
The Expectation Rigidity Problem
When you look at Fibonacci Extensions numerically, you are using the extensions to determine potential targets, not as 100% settled targets, and therefore your trading changes by not being open to reversal signals. You miss confirming signals entirely because you are fixated on the level you think price "should" reach for the target of your extension.
Although you placed great value on the 1.618 extension price level, the rice was only affected by Supply and Demand, Order Flow, Institutional Positions and many other variables. Your Fibonacci Extension is only one of many variables that can give you insight into trading.
When you trade in a flexible manner and exit for profits at 1.3080, just below your target, instead of holding on because your target hasn't yet been hit, you change your position from trading to hoping. Hoping can be very expensive.
Real Example: The GBP/USD Psychological Trap
The GBP/USD Trader identified the 1.618 extension projecting the GBP/USD to 1.31.50. Price was moving quite well up to 1.3080. However, after reaching the 1.3080 level, the Price was unable to make any further advances for three days. Multiple Shooting Star candles formed on the daily candle, and the RSI posted a bearish divergence. The Volume was non-existent.
A Flexibly Trading trader recognised these reversal signals and profited at the 1.3080 Price level just before reaching the 1.3150 extension Price target. A Rigidly Trading trader, obsessed with the 1.618 level, remained, and the price dropped to the 1.2950 Price level for a loss or breakeven.
The psychological error? Trusting the Fibonacci extension more than the price action itself.
Beginner Analogy: The Test Score Prediction
As a student, you have worked out that the score for your upcoming exam should be 92%. When you arrive at the exam, you find that the first half of the exam, the questions are based on parts of the material that you did not study well for. The question for you is whether you maintain your expectation of 92% because you calculated it or whether you adjust your expectation based on how you are performing on the exam. The obvious answer is to adjust your expectations and to use them as a guideline going forward.
Fibonacci extensions can provide you with information, but they are better used as a guideline than as an absolute. They should be used to confirm the probability that price movements in the same direction will occur. Fibonacci extensions should be used along with:
-
Observing price movement in real-time as well as the Fibonacci line
-
Understanding market conditions and levels of support/resistance
-
Taking into consideration important news and fundamental events
-
Accepting and being willing to change your expectations if something does not develop as you may have expected.
The top traders can take in and analyse market information. They are confident enough to initiate trade setups based on their analysis, but they are also humble enough to know that there is a difference between the conditions of their trade setups and the actual conditions.
Avoiding the Single-Tool Syndrome
This is not only true using ‘Fibonacci extensions’ as a way to understand your psychological mindset when trading; This serves as a reminder of the need for traders to use more than one type of analytical tool when analysing Forex (and all markets) – as the Forex market, along with all other markets, consists of complex ecosystems with interdependent components. Therefore, using Fibonacci extensions only will make you vulnerable because they do not tell you everything that is happening within the ecosystem of Forex.
Consider Fibonacci Extensions just one of a number of analytical methods and tools used in developing an overall comprehensive strategy to trading using all types of analytical tools together from multiple sources of information – including support/resistance analysis/technical and fundamental analysis, candlestick formations and volume-thoughts, etc.
Historical Case Studies and Practical Takeaways for Trend-Based Fibonacci Extensions
Even though it is important as a trader to understand the theoretical concepts and principles regarding Fibonacci extensions, we learn more about applying the concept of Fibonacci extensions with Forex in the following sections through actual examples from major currency pairs from the last few years- both successful and unsuccessful patterns will help provide you with immediate practical ways of applying Fibonacci extensions to your trading.
Success Case: EUR/USD 2023 Rally
In early 2023, EUR/USD established a clear uptrend from the 1.0500 zone. Point 0 formed at 1.0515 (January low), Point 1 reached 1.1030 (February high), and Point 2 retraced to 1.0800 (March). Traders plotting Fibonacci extensions identified:
-
1.272 extension: 1.1180
-
1.618 extension: 1.1420
-
2.618 extension: 1.1850
In three weeks, the price reached the 1.272 extension level, took a short break and then went to the 1.1420 extension target (1.618) in July. This is what you would expect. It is easy to see the trend; it was gaining momentum, and the extension levels were used as profit-taking zones as a result.
Lesson: When all of the criteria are satisfied in one direction, the trend is clearly defined, there is good momentum on the market, and there is no significant resistance that could cause the price to reverse, then Fibonacci extensions will be highly accurate.
Failure Case Example: USD/JPY False Extension (2024)
USD/JPY looked like it was going to make a bullish extension in mid-2024. The price was at the 0 point = 148.00, Point 1 = 151.50, and Point 2 = 149.20. The extension targets were 153.00 (1.272) and 154.80 (1.618). Traders opened long positions in anticipation of the price continuing higher.
-
The price moved to 152.40 before reversing back down to 152.40. So what happened?
-
The Bank of Japan made an unexpected shift in policy (this is an example of a fundamental override)
-
The extension patterns were forming exactly at a main resistance zone every month.
-
The volume of the move to Point 1 was decreasing (this was indicative of momentum divergence)
-
The RSI showed bearish divergence at Point 1 on the same chart.
Lesson: So the learning point from this example is that the technical setups (including Fibonacci extensions) can be overridden by fundamental changes and ignored when they conflict with structural resistance. Always take into account the longer-term picture.
Comparative Analysis: Extension Ratio Performance
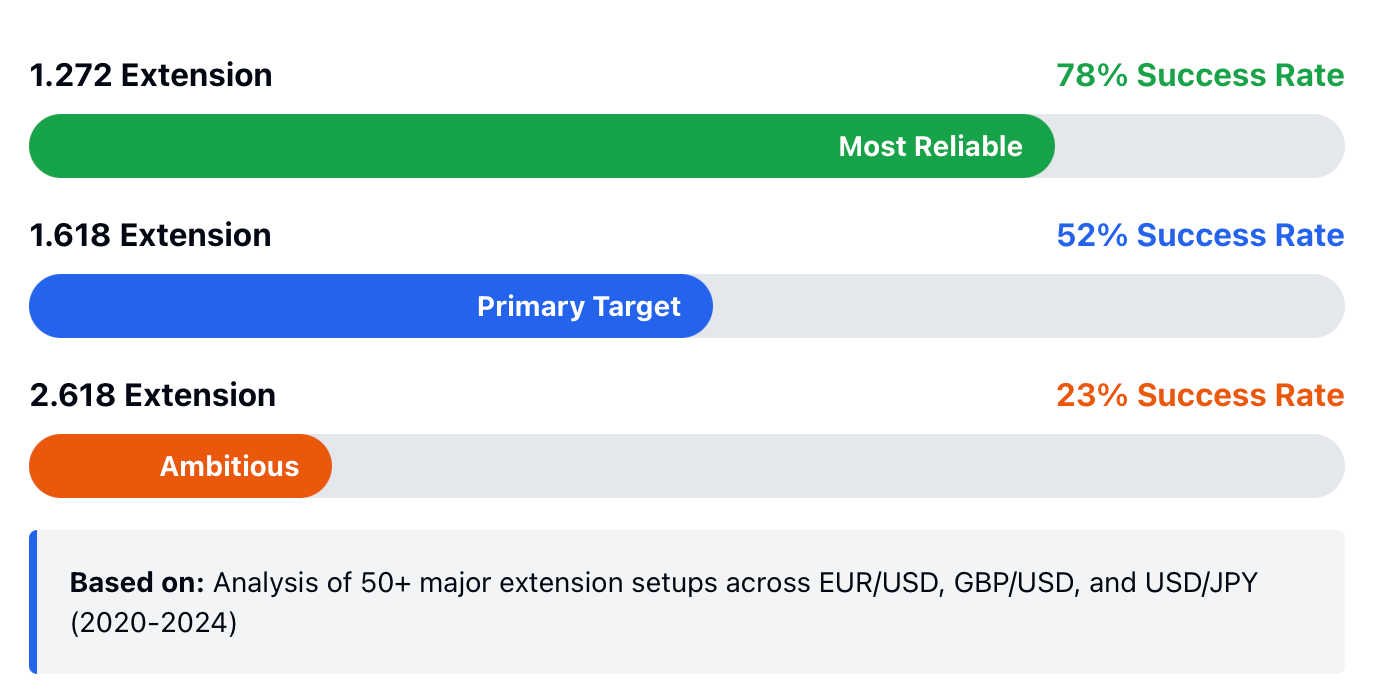
Analysing 50+ major extension setups across EUR/USD, GBP/USD, and USD/JPY from 2020-2024:
-
1.272 extension: Reached approximately 78% of the time when the basic setup was valid
-
1.618 extension: Reached approximately 52% of the time
-
2.618 extension: Reached approximately 23% of the time
What does this tell us? The 1.272 level is highly reliable for conservative targets. The 1.618 level represents a realistic but not guaranteed target for strong trends. The 2.618 level is ambitious—only the strongest, most persistent trends reach it.
What You Can Do: Take your trading approach based on these odds. At 1.272 and 1.618 levels, take profits aggressively. You can hold for 2.618 only if you have strong momentum and use trailing stops to protect your gains.
GBP/USD Multi-Timeframe Success (2022)
GBPUSD's success in 2022 was due to the alignment of Fibonacci extensions across multiple time frames. The weekly time frame provided a strong extension to 1.2450 (1.618 level) while the daily time frame showed multiple mini extended projections for daily trade price targets of 1.2150 and 1.2300, all of which formed part of a larger weekly extension.
Traders who combined these multiple time frames took profits at their daily price targets and held on to longer-term core trading positions based on the weekly target. Traders who only used one time frame missed out on the intermediate moves or were shaken out of their trades when volatility increased.
Takeaway: To successfully trade Fibonacci extensions, you must incorporate multi-time frame analysis into your trading strategy for timing and profit maximisation.
The Practice Imperative
There is a very big difference between reading about the Fibonacci extensions and using them on live markets. When you are putting your money at risk, you have to deal with the psychological pressure of being on the live market and making decisions in real time. You will also need to manage open positions, all of which you cannot practice in theory.
Therefore, if you intend to use Fibonacci extensions as an actual trading strategy, you need to have a lot of practice before starting to risk capital. First, practice plotting extensions on historical charts. Once you are comfortable with that, move to demo accounts, where you can practice executing trades in real time without risking any money. Keep track of your results. How many extensions reach 1.272? How often does 1.618 hit? What do you do wrong in point selection?
You should only move from demo to live trading after you have demonstrated success in demo trades and are confident in your ability to execute trades in real time. When you move to live trading, start small. The market isn’t going anywhere, and you have time to prepare before risking capital.
What Do You Need to Do Next?
The difference between traders who are successful with Fibonacci extensions and traders who aren't is not intelligence; rather, the difference is experience and the ability to apply discipline consistently. You should begin building your experience now. You should plot historical samples, test your trades on a demo account and keep track of what works and what doesn't. As you build your experience with these methodologies, you will recognise patterns and instinctively know how to make decisions in response to those patterns.
Stop reading and start practising. Open a risk-free demo account at BTCDANA.COM and test these trend-based Fibonacci extension strategies with live market data. Master your plotting technique, refine your entry timing, and build the confidence you need before trading with real capital.