


Introduction: Why Every Trader Needs to Master Forex Strategies
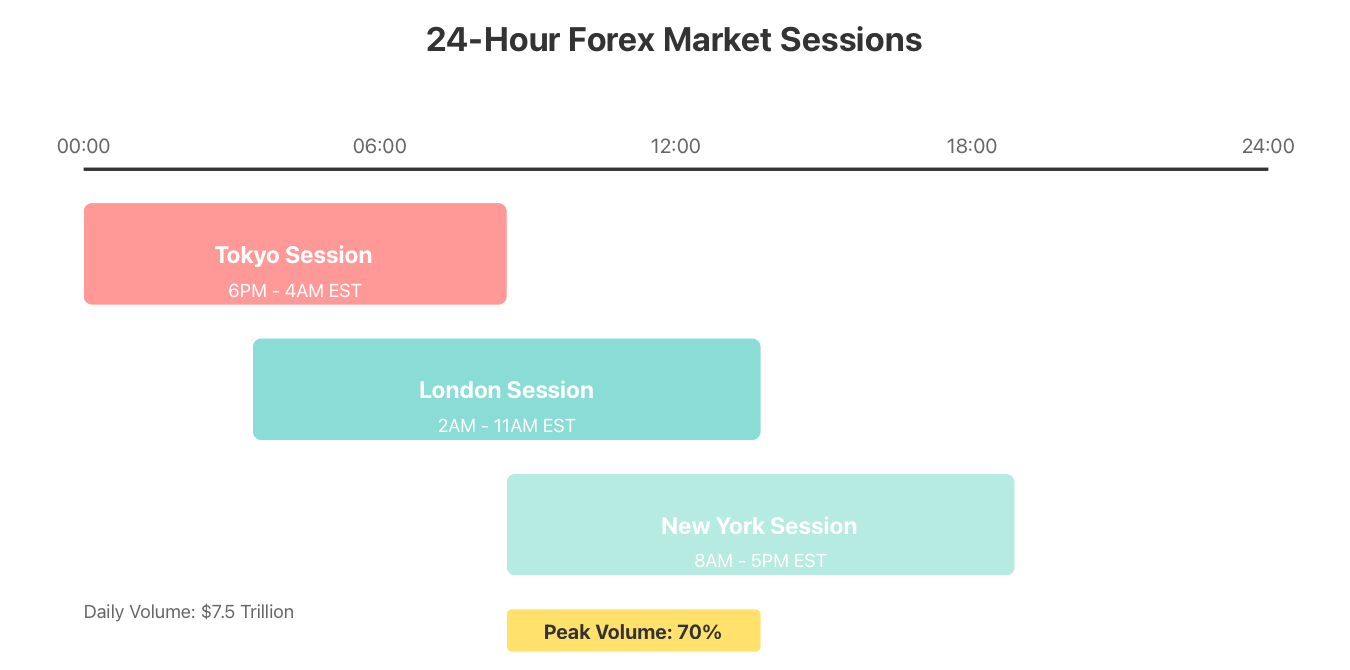
The Forex market is one of the largest financial markets out there, with over 7.5 trillion dollars traded every single day, 24 hours a day, 5 days a week! Unlike other financial markets, which close at the end of each trading session, forex operates 24/7. The market will continually operate; when Tokyo closes for the day, London opens up. When London starts to wind down, New York will take over.
With forex being so big and easily accessible, it doesn't always mean that you will make money. Many new forex traders enter the bullion market hoping that they will be able to flip money quickly and easily, only to see their accounts deplete faster than they would like to admit. What is the difference between the trader who consistently makes a profit vs. the trader who does not? Forex strategies.
One of the most important things to note is that a successful trading strategy will give you a structure. It provides you with predetermined areas where you want to enter, exit, and how much to risk for each trade. Creating a structure will allow you to trade regularly, controlling your risk and maximising the size of your potential profit.
In the following guide, you will: Find out what the most common Forex strategies that forex traders actually use, such as trend following, range trading, day trading, reversal methods, and breakout strategies; Learn how to apply them as well as how to manage your risk effectively, and combine trading strategies for greater results.
Suppose you are an expert currency trader dealing with EUR/USD. There is no "guessing" involved in predictive pricing. Instead, expert traders utilise historically successful trend strategies that successfully predict market trends and then base many subsequent trades on either existing trades or the forecasts of previously successful strategies.
New traders with little experience using the USD/EUR trading pairs have the chance to maximise their profitability from their first trade by leveraging a validated approach. The information in this guide provides you with a wealth of options for identifying what types of trading strategies work best for you, as well as how to apply them in the live marketplace.
Trend Following Strategies: How to Ride Market Trends
Trend-following Forex strategies are one of the top-performing strategies in the trading world. These strategies have a simple concept: figure out which direction the market is going in and trade in that same direction. If the market is rising, buy; if it is declining, sell. The way to lose money is to fight against the trend.
How Trend Following Strategies Work
The forex market trends more than many believe. Currency pairs don’t simply bounce around; currency prices move in one direction for long periods due to several reasons, including macroeconomic factors, monetary policy changes, or even just general market sentiment toward that market. The trading opportunity for traders is to identify these trends early and ride them until they're finished.
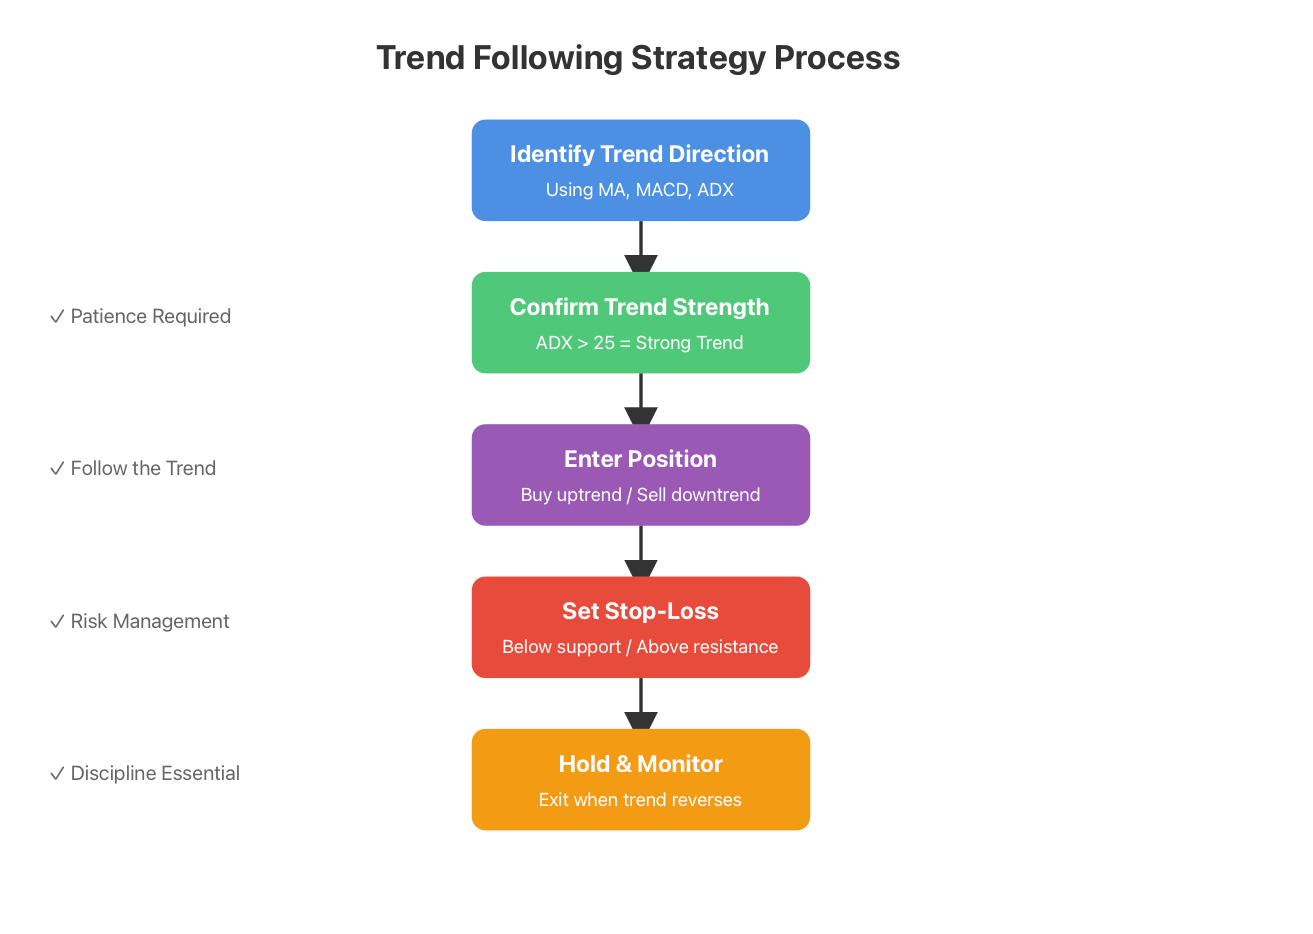
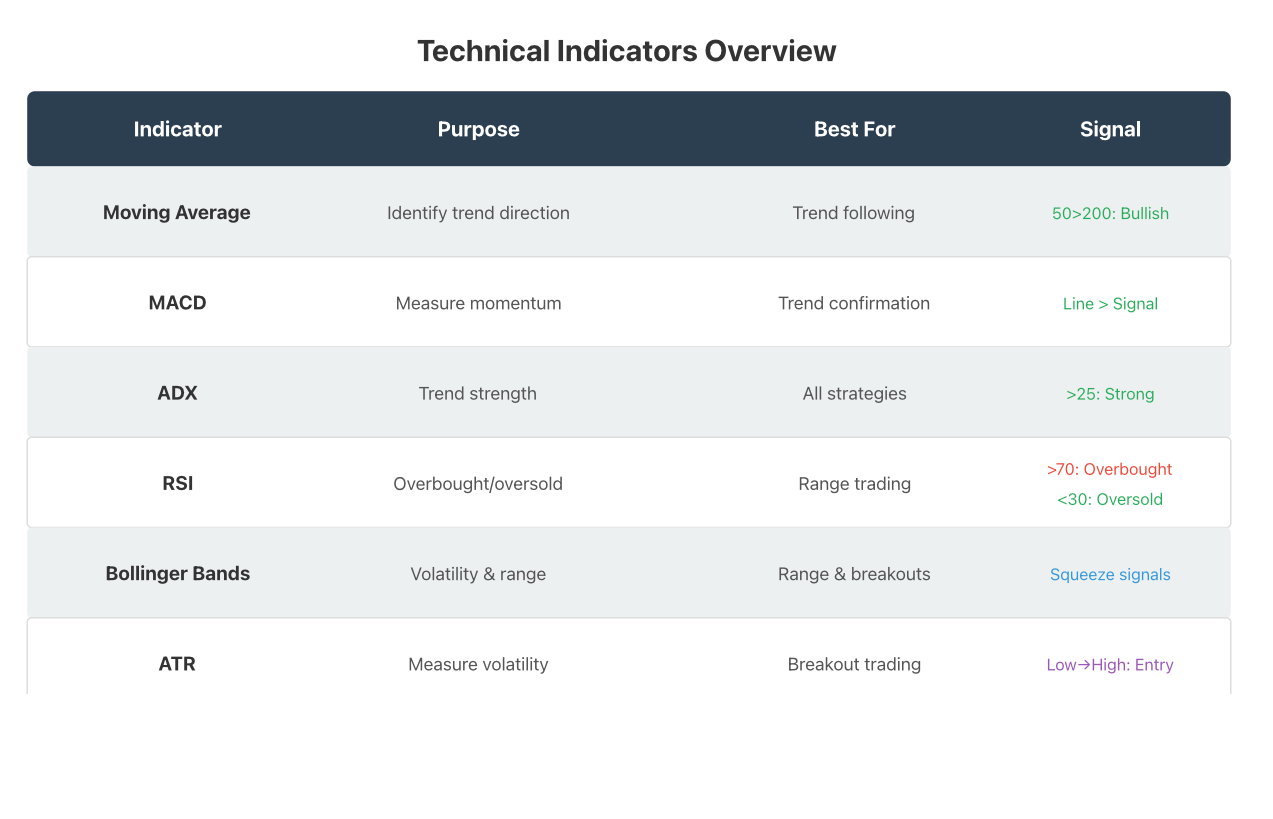
The most common indicators traders use to identify trends are moving averages (MA), MACD (moving average convergence divergence), and ADX (average directional index). MA (moving averages) displays an average price to help traders visualise and confirm what the underlying trend is. Crossovers of moving averages can be interpreted as bullish or bearish signals; when a short-term MA (like a 50-day) crosses above a long-term MA (like a 200-day), this is a bullish crossover, while the reverse is true in a bearish crossover.
The MACD indicator is best known for pinpointing shifts in momentum. When the MACD line crosses above the signal line, this indicates that upward momentum is developing. Opposite the previous statement, when the MACD line crosses below the Signal line, that indicates that Downward momentum is developing.
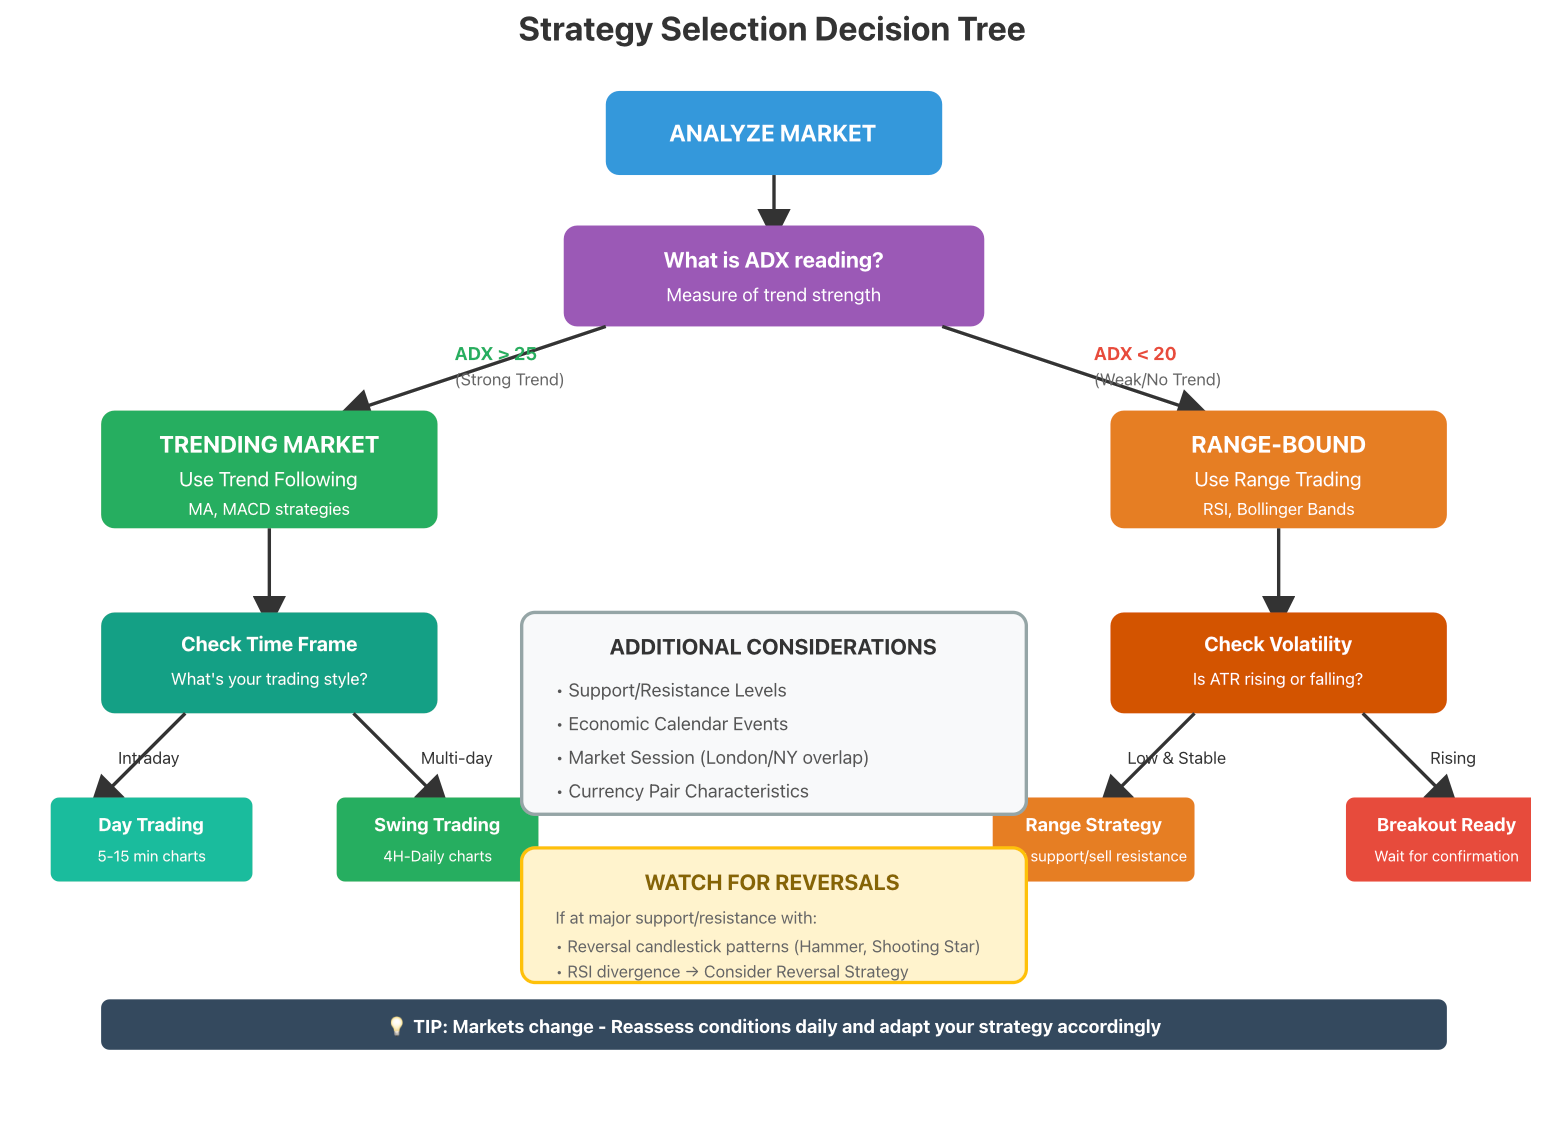
ADX tells you how strong a trend is. A reading over 25 means there's likely to be a very strong trending market. When below 20, it's likely that the market is simply moving sideways (chop).
Using Trend Indicators
A professional forex trader may look for an opportunity to trade EUR/USD by first observing the 50-day moving average (MA) crossing above the 200-day MA. Then, MACD confirms this by showing positive momentum with a bullish crossover, followed closely by the ADX crossing above 25. These are their signs to enter a long position.
Most professional traders will continue to hold their open positions until they see that the market has reversed direction, at which time traders may exit with a profit. It may take several days, weeks, or sometimes even longer to realise these profits, so patience is extremely important for trend traders; they do not attempt to catch all relative moves but instead focus on capturing large trends.
It's important to remember that you are trying to slide down a steep hill, and the only way to go fast and stay safe is to follow the direction in which gravity is drawing you, rather than trying to fight against the pull of gravity.
Risk Management in Trend Trading
The greatest danger is a market reversal without you having realised that you need to take a loss. Therefore, it is important to use stops. Establish a stop level just below prior support levels while there is an uptrend or above prior resistance levels while there is a downtrend. If the price level of the asset trades below or above. These levels could indicate the end of the trend.
More advanced traders will utilise multiple time frames. First, they generally will identify the general direction of the trend on a daily chart, then drill down to 4-hour or 1-hour charts for precise entry and exit levels for each trade. In this manner, they can trade in conjunction with the larger trend while being able to time their trades with the shorter-term price movements.
The EUR/USD and GBP/USD pairs will act as ideal pairs for traders using trend-following strategies due to the sustained directional movement after significant changes in the economy. Master the art of trend following to capture many of the best and largest profit opportunities in the forex market.
Range Trading Strategies: Profiting in Sideways Markets
Not all markets follow trends. Some markets simply go from support to resistance back to support, rather quickly! Range trading was developed for these more sluggish markets. When a market moves sideways and is difficult for trend following traders, range traders can continue to make profits.
How do you range trade?
Range trading is as simple as it sounds. You buy low (support) and sell high (resistance). Market prices move between support and resistance like a ball bouncing against a wall. Profits in range trading result from repeatedly buying at the bottom of the range and selling at the top.
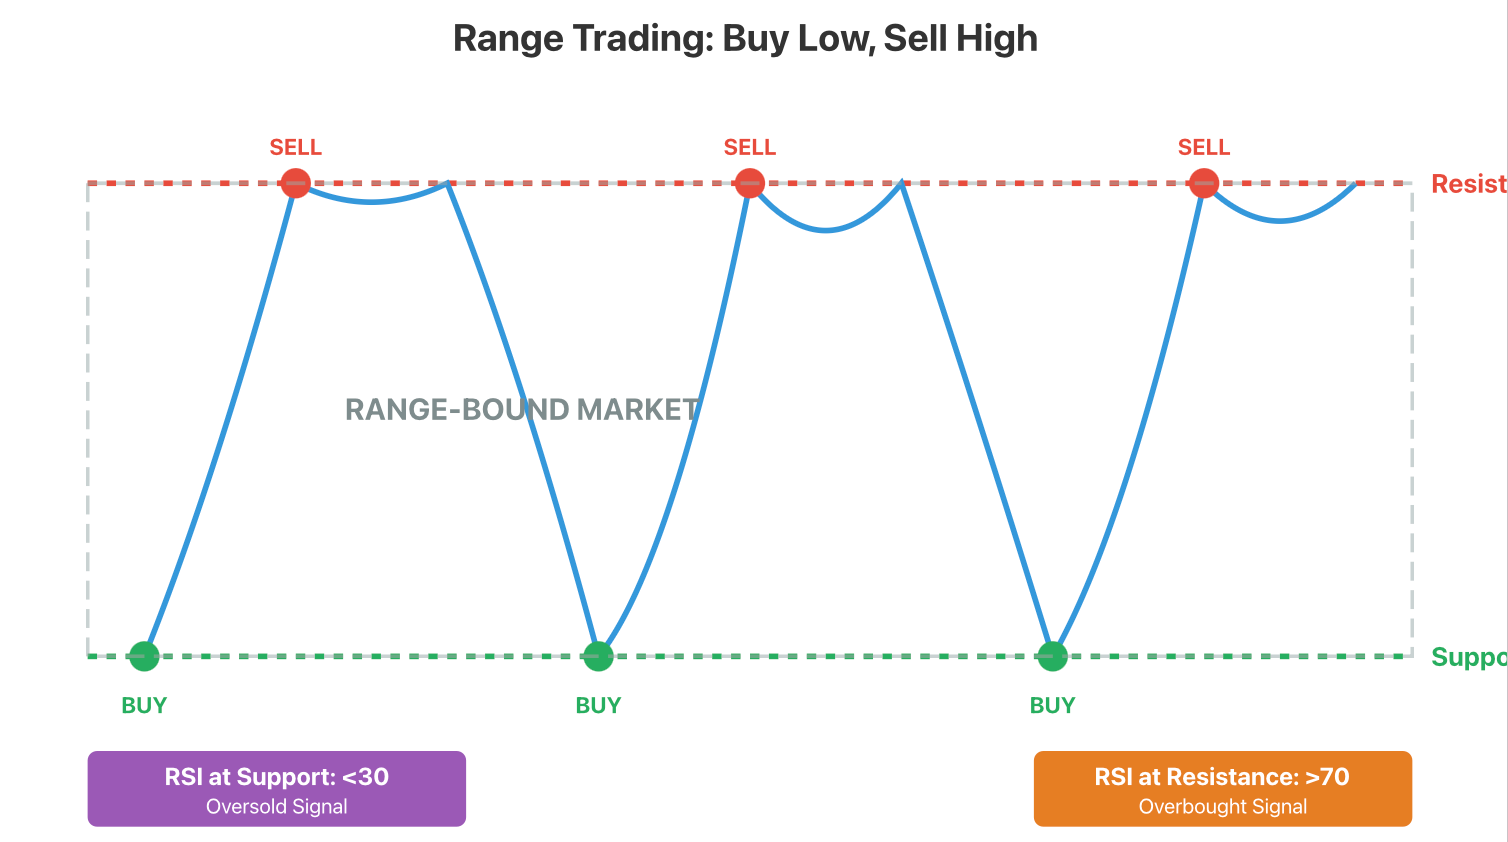
The most important thing about range trading is how to identify when the price is "range-bound." You should be able to identify horizontal price action and see that price highs and lows are continuously reaching the same price levels. After identifying a range, you should know when to enter into a position based on timing.
Indicators for Range Trading
The relative strength index (RSI) is an excellent indicator for range traders to use. The RSI is an oscillator, measures if your currency pair is currently overbought or oversold. An RSI under 30 indicates it has been oversold and is due for an upward movement. An RSI above 70 indicates it has been overbought, and it is likely to decline.
Bollinger Bands work great, too. The bands are designed to track price movements as they can deliver an indication of whether prices are higher, lower, or stable at any point in time. They are very useful on charts as traders use the Bollinger Bands to identify opportunities to buy/sell within the range of the bands. Price usually bounces between the upper and lower bands of the Bollinger Bands in a range-bound market.
A trader can also use the Relative Strength Index (RSI) in conjunction with the Bollinger Bands to enter/exit positions at optimal levels when the RSI is at 70/30 and is located within the upper or lower bands of the Bollinger Bands, respectively.
Example of Range Trading
Assume that the GBP/USD has been range-bound between 1.3800 and 1.3900. The price is repeatedly bouncing off and back to 1.3900 on the way up and back down, and 1.3800 when it hits the bottom and back up. In this type of market, a range trader follows the movements of the RSI and then waits until it reaches the 30 level and buys near the 1.3800 level. Once the RSI moves back up to 70, they sell and exit at approximately 1.3900.
Risk of Range Trading
The primary risk in range trading is breakouts. When support and resistance levels are broken, the price can break through the prepared range in which a trader may be making profits. If a trader does not react quickly, it can create a large amount of loss extremely quickly.
Stop-loss orders are mandatory and should be placed outside the previous range’s boundaries. If the GBP/USD breaks below 1.3780, you will have exited the market before incurring a larger-than-desired loss. This will also apply if the GBP/USD breaks above 1.3920.
It is not advisable to force trades using the range strategy when there is a distinct trend. A range strategy will only work if the price action is moving sideways.
Range trading will not yield the same large trend-following profits as other strategies, but it does provide a consistent income stream when other strategies are waiting for trend development.
Day Trading Strategies: Short-Term Profit Techniques
The day-trading technique is speedy in nature. All trades executed by traders are opened and closed on the same day. As such, a trader does not hold any trades overnight and, therefore, does not have to worry about anything that occurs whilst they are asleep. The nature of the day-trader's activities is very fast-paced and requires extreme concentration.
What Makes Day Trading Different
Unlike those who swing trade and take positions for days or weeks at a time, day traders take advantage of small price fluctuations within a single trading day worth of time. A day trader could enter multiple trades on the same currency pair between five and ten times during a single trading session, with the expectation of making between 10 pips and 30 pips per trade. While the upside of this trading style is that day traders do not incur overnight risk, as an example, a news announcement after the close of the market may create a "gap" in pricing and negatively impact a swing trader's profits.
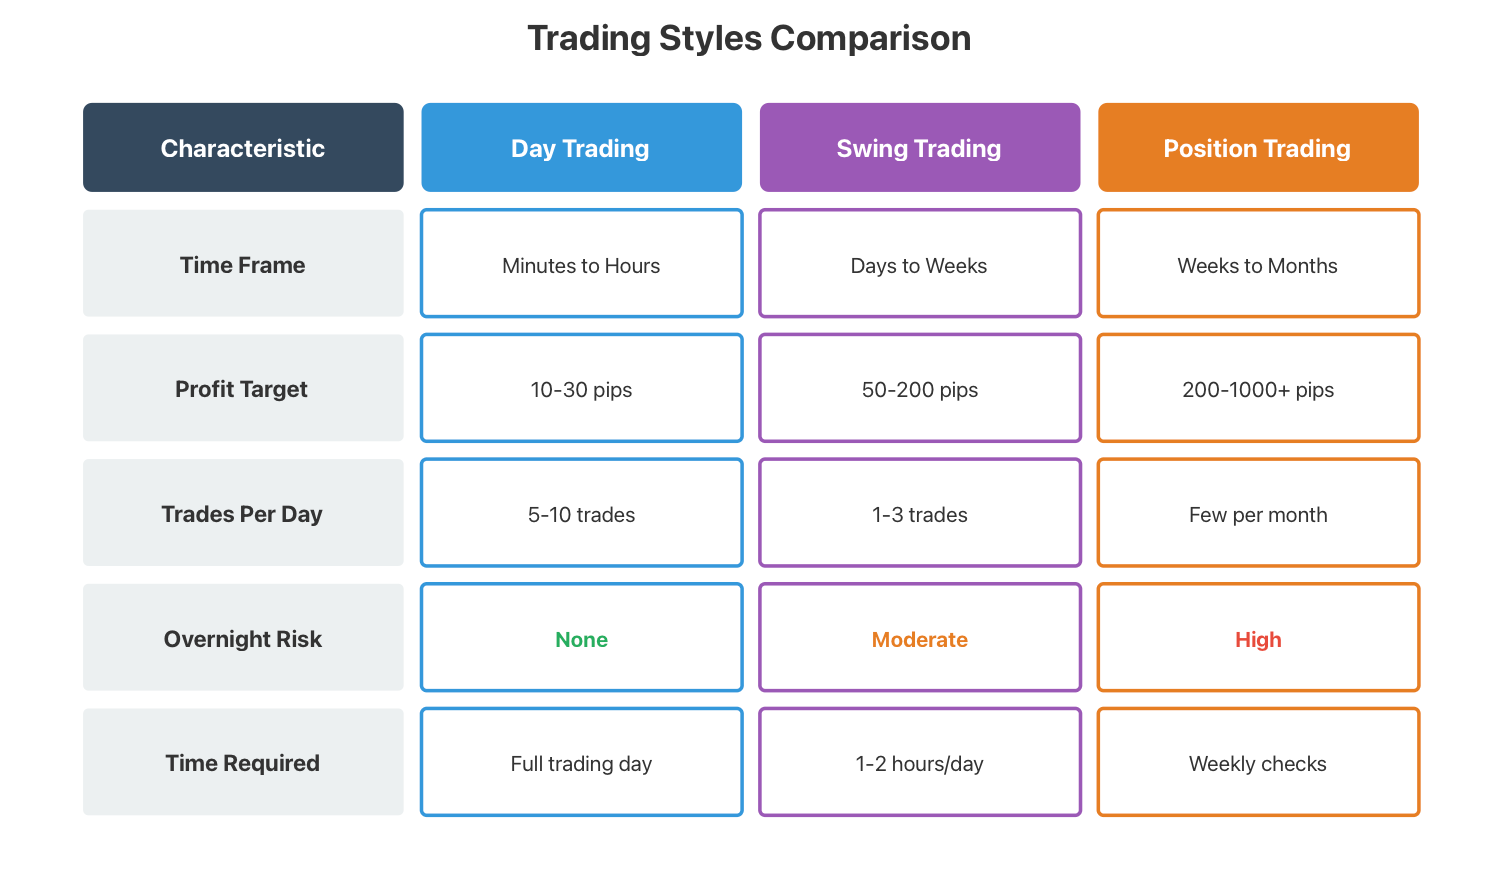
However, a day trader effectively avoids being impacted by this phenomenon, but if you are a day trader, you must remain glued to your computer for the duration of the trading hours.
Tools and Techniques
Day traders trade much shorter than a swing trader or long-term investor. They may be trading on 5-minute, 15-minute, or one-hour charts. They are looking for the support and resistance levels as they develop intraday. Day traders utilize support and resistance levels that develop intraday to identify entries and exits.
In day trading, volume is much more important than in longer-term trading. When a price level has a high volume, this tells a trader that the price level has a higher level of importance than price levels that have a low volume (low volume at that price level will likely not hold).
Most day traders focus on the overlap of different markets. The overlap of the London and the New York sessions (8 AM to 12 PM EST) is the most liquid and volatile. During this time, liquid and volatile markets create opportunities for day traders to take quick trades and have multiple trading opportunities.
Trading Intraday Moves
For example, take EUR/JPY: On a given day, this pair may move from 50-100 pips. As a day trader, you would take small dips of about 5 pips and capture small rallies of around 5 pips. You're not trying to capture the full day range, simply capturing small pieces.
Think of it as going to the grocery store looking for the best deals of the day. You quickly find your items, grab what you need, and get out before they go bad or are sold out.
Risk Management for Day Traders
Day trading is a discipline that requires strict risk management to be successful. Whenever a trader makes multiple trades in one day, there exists the potential to have an oversized loss that could wipe out a week of profits from successful trades.
Position sizing is one of the most important parts of day trading. Many day traders will limit their risk per trade to only 0.5%-1%. This may seem small, but over the course of taking five to ten trades in one day, this small percentage adds up.
When a day trader sets their stop-losses, it is important to find a good balance between keeping them tight enough to protect against normal price noise triggering the stop-loss and keeping them wide enough not to allow for an unreasonably large loss on a losing position. Finding this balance takes a lot of practice.
In addition to this, a trader should never hold onto a losing position in hopes that it will turn around; if the position does not fit with the trader's original thesis, he/she should exit the position and move on because there will always be additional opportunities coming within the next hour or two.
Traders looking to make money through day trading tend to favour pairs such as EUR/JPY and USD/CHF, which have a relatively consistent price movement throughout the day without excessive volatility. If a trader can develop a discipline of cutting off losses as soon as possible and booking profits frequently, day trading can be a very lucrative business.
Reversal Strategies: Capturing Trend Reversals
The practice of reversal trading is about recognising the point at which a trend will reverse its direction as opposed to continuing on. With reversal trading, traders are positioning themselves for an opposing move instead of following the current trend. While reversal trading carries more risk than trend following, it can potentially yield substantial profits when executed properly.
Understanding Reversals
As we know, no market will continue to maintain a trend indefinitely. At some point, whether positive or negative, the market will run out of buyers or sellers, and thus, the market will commence its reversal. As a result, you will be able to take a position much earlier than the rest of the trading community in relation to the reversal drug that is about to go off. Therefore, the key is being able to identify real reversals from the temporary pullbacks that we have seen with many recent trends. This analysis is done using proper technical analysis.
Key Reversal Signals
A primary resource when determining trades is Candlestick Patterns. Reversal signals include the Hammer, Shooting Star, Engulfing Patterns, Doji Candles, etc. The Hammer represents a reversal pattern at the end of a downtrend.
A Hammer indicates that there were sellers pushing down on price, but buyers entered aggressively and pushed the price back up. A Hammer may indicate that the trend has exhausted itself. A Shooting Star represents the end of an uptrend.
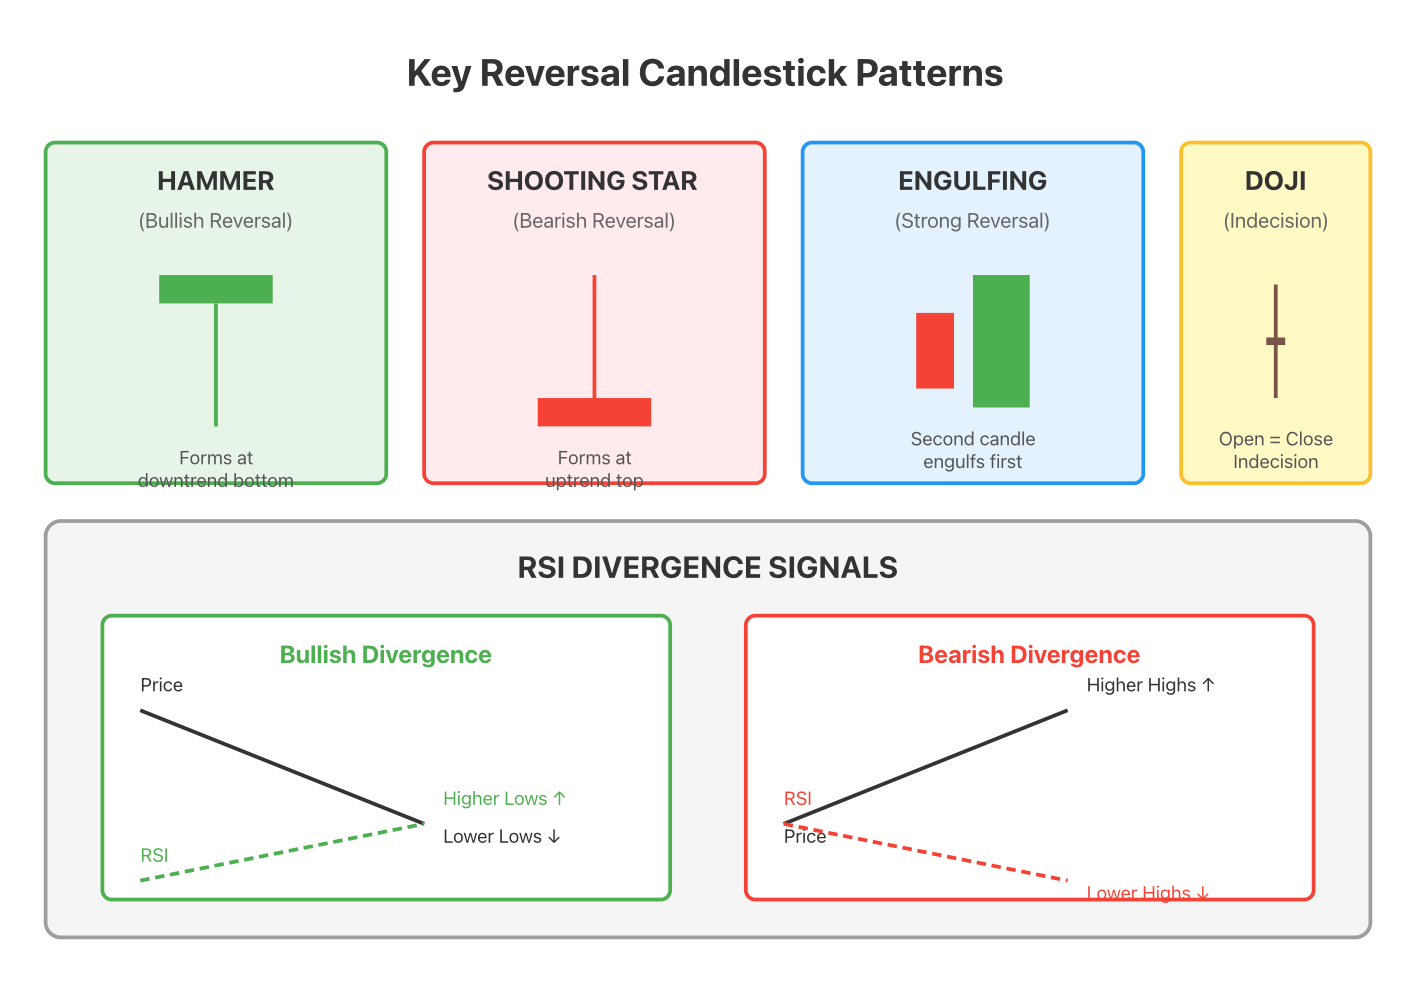
A Shooting Star occurs when there are buyers pushing up on price, but sellers come in and push the price back down. Therefore, a Shooting Star indicates the possibility of the end of the uptrend. RSI Divergence is also a powerful reversal signal. Whenever a stock reaches a higher price, but the RSI reaches a lower price, the momentum is losing strength, and it indicates a potential reversal of the uptrend. The reverse is true with downtrends.
Trading Reversals
You start to see an uptrend when the price reaches an important support level. You see a Hammer candle pattern and also observe that the RSI is displaying bullish divergence. These are early signals that traders can use to enter a trade.
Once you identify this as confirmation, you place a buy order and set your stop loss just below the low of the Hammer candle. If the trend changes, you now have an opportunity to ride out a multi-week rally very early on in the process.
Think of it as waiting for a ball to hit the ground before swinging at it. If you swing at the ball while it's still in the process of dropping down, then you may miss out on hitting it correctly! However, once the ball hits the ground, that gives you confirmation of where the ball is going to go, and so you will know when to time your swing properly!
Risk Management in Reversal Trading
For reversal trading, it's risky to trade against the trend. The majority of all attempted reversals fail, so having confirmation is extremely important before entering a trade based solely on a Hammer or Shooting Star. You should wait for multiple indicators to show the same signal.
When placing a stop loss, make sure to have it tight. If the reversal fails and the previous trend resumes, you will want to close your position as soon as possible. Most reversal traders place a risk-to-reward ratio of 1:3 or higher, with some going as high as 1:4. They are usually aware that the majority of their trades will lose; however, the winners tend to be large enough to compensate for the losses.
It is not advisable to try to pick tops and bottoms without confirmation first. Attempting to catch a falling knife is a recipe for disaster; instead, allow the knife to hit the floor and stay there before picking it up!
The EUR/USD and AUD/USD will offer some great opportunities for reversal trading, especially around the major economic releases and at the major technical levels. Once you have developed the ability to identify these reversals, you will have the chance to capture some very large moves in the forex market!
Volatility Breakout Strategies: Catching Big Moves
The goal with breakout trading is to capture sudden, powerful price movements. This is when the price has historically been moving within a tight range before breaking out explosively, indicating that now is the time to enter the trade. Breakout trading is a high-risk, high-reward strategy due to its reliance on precise timing and advanced risk management strategies.
How breakout trades work
The market will not remain stagnant indefinitely. After a period of consolidation or sideways movement, prices tend to break in one direction or the other. When this occurs, there will typically be a massive amount of stop-loss orders along with a surge of new buy orders being created, which creates a tremendous amount of momentum that can last for hours or days.
You want to get into a breakout trade as early as possible and then ride the trend for as long as it lasts. The most challenging part of this trading strategy is differentiating between genuine breakouts and fake-out moves.
Key Indicators for Breakout Trading
ATR (Average True Range) measures volatility. When ATR is low, the market is quiet and consolidating. When ATR starts rising, volatility is picking up, and a breakout might be imminent.
Bollinger Band squeeze is another classic signal. When the bands contract tightly around price, it means volatility has compressed. The tighter the squeeze, the more explosive the eventual breakout.
Support and resistance levels are critical. A breakout above resistance or below support with strong volume confirms the move is real.
Trading Breakouts
In order to trade professionally, a trader observes a price range for the EUR/USD currency pair that is narrowing. The Bollinger Bands are closing in on each other, and the Average True Range (ATR) shows a decrease in volatility over several weeks.
After noting that the price is likely to break out in either direction, the trader establishes pending orders above the identified resistance level and below the identified support level.
When the price increases above the resistance level, it is accompanied by strong trading volume. The trader immediately activates the buy pending order and will set a stop-loss order just below the resistance breakout area. If the trade indicates genuine breakout activity, the price will continue to increase, allowing the trader to profit. If this indeed was not a true breakout, the trader will take a minimal loss due to being stopped out.
The concept of waiting for the price to reach an absolute top or bottom before executing a trade is akin to waiting for a jump rope to fully unwind before jumping into it. This method of execution provides frequency and reliability to the trader.
Risk Management in Breakout Trading
Among all options, false breakouts represent your greatest risk. Instead, the momentum drops or reverses on you immediately after entering. All of these false breakouts come with a financial cost and a lot of whipsaws. Be careful not to fall for false breakouts; confirmation is much more important than entry based on a single price movement.
A price breakout may be confirmed as a new support level if the price breaks above resistance and shortly tests it, then subsequently goes up. Therefore, before taking a position based solely on a price break above resistance, always wait for the candle to close first. It's best to wait for a test of the broken resistance level after the breakout, which is an example of a strong confirmation.
Position sizing is also critical. Traders should typically have a position size of half their normal breakout entry size until they see a profit from their initial entry. If the initial entry is profitable, traders can then use both their profit from this initial entry as well as any additional funds they make available to them to add to their winning trade.
To set your stop-loss levels on breakout trades, set your stop-loss level just within the base or range. If the breakout level has been broken (for example, if EUR/USD closes above 1.1000), place your stop-loss just below it (for example, 1.0980). If the price falls back into the range, the breakout was ineffective, and you don't want to be in the trade.
For breakout strategies, the major news releases or economic events around which they are performed can provide excellent breakout opportunities in "hot markets," including WTI crude oil, gold, EUR/USD, and GBP/USD. When these trades are performed correctly, a single trade can produce a week of profit in less than one day.
Risk & Money Management in Forex Trading
The best forex strategies in the world will not be effective without proper risk management and could lead to the loss of your entire trading account. Risk Management is therefore Mandatory. The difference between a trader who loses their account and a trader who does not is the trader's risk management practices.
Position Sizing and Leverage
Leverage has both positive and negative effects. Leverage is beneficial when used correctly. Leverage can increase the amount of profit you can earn for a given amount of capital (it allows you to trade larger amounts of currency), while also taking on more risk. Most brokers offer a leverage ratio of anywhere from 50:1 up to 100:1. As exciting as leverage may seem, one must also take into account how a small movement of 1% against your position could potentially wipe out the entire trading position.
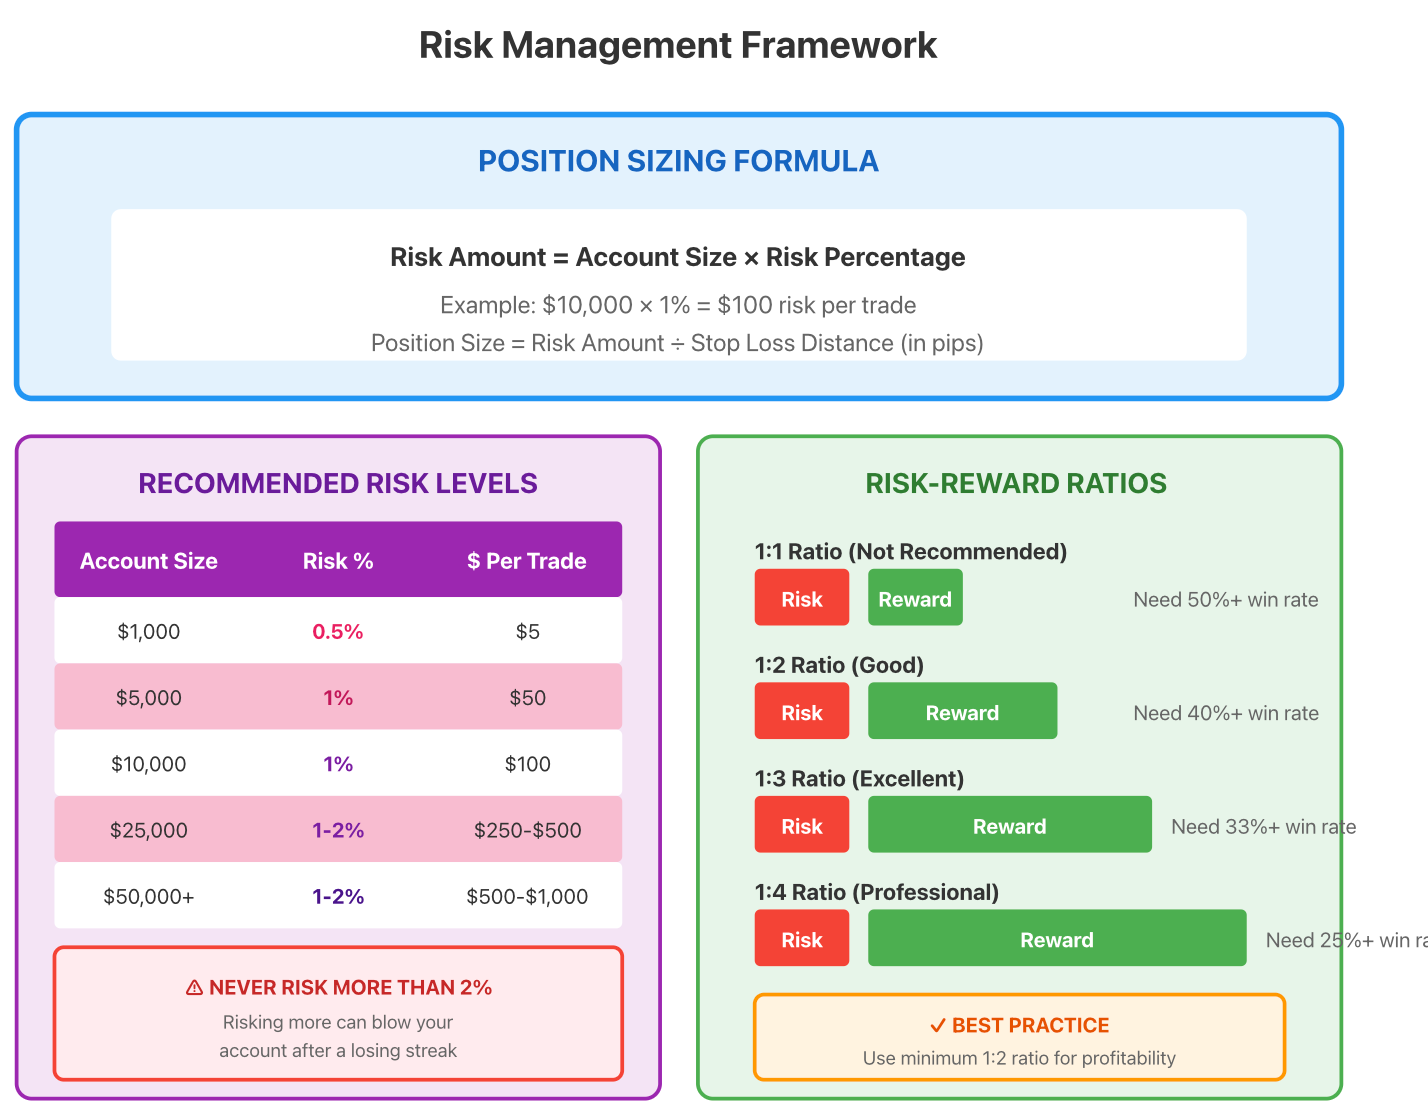
When following professional traders' standards of risk management, the maximum amount of risk they are willing to take on per trade is typically 1-2% of their account balance. For instance, if you have an account valued at $10,000, the maximum allowable risk per trade is $100-$200. You may feel like this is a conservative amount of risk; this is by design! By applying proper position sizing, you can withstand 10 or even 20 consecutive losses without damaging the trading account.
The formula to use for calculating your risk per trade is:
Risk Amount = Account Size × Percentage of Risk.
You will then need to adjust your position size based on the distance of your Stop Loss (if your risk amount is $100 and your stop loss is 50 pips away, use that to determine what your position size would be, so a loss of 50 pips would equal $100 in losses.
Stop-Loss and Take-Profit Setup
Always place a stop-loss order before entering any trade; don't forget to also put in a physical stop-loss order, rather than a mental one! If you don't do that, emotions will kick in when your trade begins to go the other way. You might think that it will come back, but the chances are it won't!
Set your stop-loss orders at very reasonable levels, below the support level for long trades or above the resistance level for short trades. The better way to do this is to use the structure of the charts to help determine your stop-loss.
Take-profit orders should be based on risk-reward ratios; most successful traders use a ratio of at least 1 to 2 when placing take-profit orders. This means for every $100 that you risk, you will make $200. Therefore, over time, you will only need to win 40% of the trades you take to be profitable.
Diversification
Never risk all of your capital on one trade or even one currency pair. You should always diversify and place your capital in multiple trades. For example, if you are trading the EUR/USD with a trend strategy, you might also be trading GBP/JPY with a range strategy. This way, one bad trade will not affect your entire week.
By balancing out different strategies based on the current market conditions, your overall portfolio will be more balanced. For example, if you are currently experiencing a period of trendless markets, you might want to look at trading ranges instead; or, if you have an exotic pair moving strongly, consider trading the exotic rather than the major currency pairs.
Emotional Management
One of the most challenging things to do is to put off emotions and make logical decisions. In addition, many traders will try to "recoup" their previous losses by using larger amounts. This is a mistake. By trying to recover from a loss without waiting for enough time to pass to find out how the market is doing, a trader can quickly turn a bad day into an entirely blown account.
Accepting that losses are part of trading is what separates successful traders from the rest of us. Most successful traders lose between 40%-50% of the trades they make. What really matters is that winners are usually worth more than losers, and you will be allowed to trade in the future if you continue to make a profit.
An analogy for your trading career would be your health point (HP) as a character in a video game. If you are a character and get hit and lose your HP by 1, then you do have a chance to recover and advance in the game. But if you lose your HP to a single hit, then your game will most likely be over.
Most professional traders will only risk 1% on a trade when they are trading EUR/USD. This happens for 2 reasons: EUR/USD is highly liquid, and the spreads are relatively tight on this currency pair. The combination of the trader's ability to size trades properly and the ability to place stops appropriately and/or limit emotional decision-making separates skilled or successful traders from other traders.
Combining Forex Strategies for Maximum Profit
Every trader has a different strategy depending on the interpretation of market conditions. Though it’s impossible to have just one strategy that’s successful all the time, several successful traders utilise multiple strategies and adapt to changing market conditions as they arise.
Why Combine Strategies?
When markets trend, trend traders are rewarded. When markets are in a range, range traders are rewarded. When there is volatility due to a breakout, breakout traders are rewarded. Traders who only know one way to trade will only profit when a market is following that approach.
If traders combine several strategies, they will be able to profitably trade across different market conditions. When markets are trending, traders can use their trend-following approach, and when markets are in a range, traders can shift to their range trading approach, or if they have a breakout strategy, use that to capitalise on breakout opportunities. This can greatly increase the chances of being successful across different market conditions.
Trend Trading + Range Trading Strategy Switching
An example of this concept would start with the analysis of the EUR/USD currency pair. On a daily chart, if the ADX indicator is reading greater than 25 and the price is making higher highs, this indicates a trend is forming and sets the stage for a trend-following strategy or approach. A trader would look for pullbacks to enter the market in the same direction as the trend.
Later in the week, if the ADX indicator drops below 20 and the price begins to oscillate between the resistance level of 1.0900 and the support level of 1.0800, this tells the trader that the trending move is over and to start using a different approach altogether.
At this time, a range-trading strategy would apply, and if the RSI indicator is reading below 30, the trader would enter a buy order at the support level of 1.0800 and put on a sell order at the resistance level of 1.0900 when the RSI indicator is reading above 70.
If the price breaks above 1.0900 and increases with an increase in volume, you then enter breakout mode and follow the new trend.
Combination of Intraday and Reversal
Some traders combine day trading with reversal signals. Traders look for major reversal patterns on the 4-hour and then use this to assist them in entering their day trades by switching to the 15-minute timeframe.
For example, the Hammer reversal pattern is formed on the EUR/USD 4-hour chart at a major support area, which is a confirmation of a reversal. However, instead of entering the trade immediately, traders will wait for the 15-minute chart to show momentum in the direction of the reversal before entering for a potential multi-day reversal, but entering at an intraday level of accuracy.
Combining Multiple Timeframes
This is one of the strongest combinations for traders. The Daily chart shows the long-term direction, the 4-hour chart the intermediate trend, and the 1-hour chart shows the entry points by using intraday charts and the Daily and 4-hour charts for longer-term support and resistance areas.
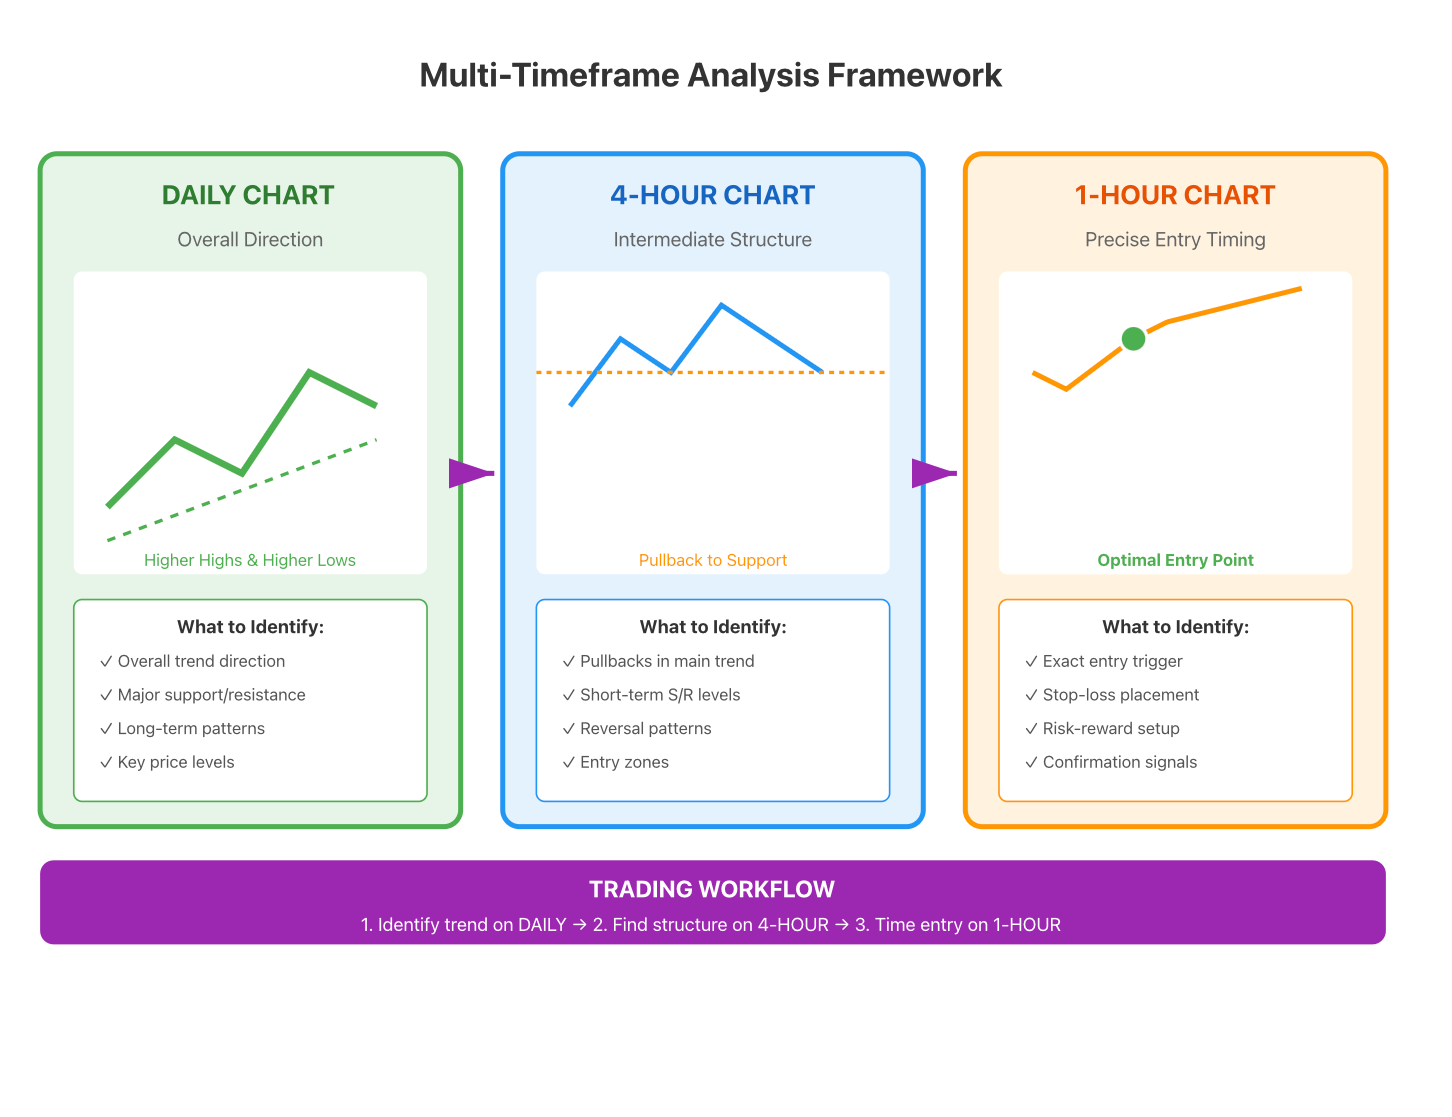
If the EUR/USD Daily chart shows a bullish trend. The 4-hour chart pulls back to support. The 1-hour chart shows an entry by giving bullish reversal signals or candle patterns at a 4-hour support area where bullish candle formations occur. This is when you go long or buy for the long-term trend by following the Daily chart.
It's like using a map for the big direction and your eyes for the small steps. You need both to navigate successfully.
Practical Implementation
A professional may use a variety of available techniques based on market conditions, such as primarily (60%) using trend techniques, 30% range techniques, and 10% breakout techniques. The specific mix of techniques will depend on how often the markets behave similarly.
Also, the specific technique will depend on the currency pair. The EUR/USD has a strong trend, so in that case, trend techniques will dominate. GBP/JPY has a lot of volatility, so breakout and reversal techniques are likely to work better in that market.
The most critical factor in determining which technique to use is understanding the framework for how to make that decision. Is the market currently trending, or is it in a range? What is volatility like? Have we reached a key support or resistance level, or are we in the middle of nowhere? Once you answer those questions for each pair, you can determine which technique to use.
Combining techniques does not necessarily equal more trading; rather, it is smarter trading, using the right tool at the right time according to the current market situation. This type of methodology results in improved win rates as well as smoother equity curves because you are adapting to the market rather than fighting against it.
Matching Technical Indicators with Strategies
There are many indicators, but not all work with every forex strategy. Choosing the wrong one to accompany your strategy will make it inefficient and frustrating; just as you would not use a hammer if the job required a screwdriver.
Trend Strategies: MA and MACD
Moving Averages are very popular for trend-following systems; they eliminate "noise" and provide insight into the direction of price movement. The two most common Moving Average periods are 50 days and 200 days. When the 50-day Moving Average crosses above the 200-day Moving Average, a bullish (upward) trend is evident. If it crosses below, the trend is bearish (downward).
MACD works in conjunction with Moving Averages to confirm the strength of the trend. A bullish crossover of the MACD indicator with the Moving Average (MA) indicates a strong trend-following entry point; for example, if the 50-day MA just crossed above the 200-day MA (a bullish crossover) and the MACD crosses above zero, this is an indication of a strong trend-following entry point.
Range Strategies: RSI and Bollinger Bands
The Relative Strength Index (RSI) is an excellent indicator for range traders because it indicates overbought and oversold levels. When prices are trending sideways in a horizontal direction, the RSI should bounce back and forth between 30 and 70. Therefore, the RSI can be viewed as a buy and sell signal.
Bollinger Bands highlight the range boundary visually, providing traders with clean boundaries on the current price action. If prices are hitting the bottom Bollinger Band, and RSI has hit the 30 level, this is an actionable signal to enter into the market with a Long (Buy) position at that price level. Conversely, if prices are hitting the top Bollinger Band, and RSI has hit the 70 level, this is an actionable signal to enter into the market with a Short (Sell) position at that price level.
Using both together improves accuracy. RSI tells you when, Bollinger Bands show you where.
Reversal Strategies: Candlestick Patterns and RSI Divergence
The Hammer and Shooting Star candlestick patterns visually represent shifting supply and demand, making them ideal for developing reversal strategies and identifying specific points where either buyers or sellers gain control of the market.
A key component of confirming price action is divergence in RSI. Divergences occur when price creates a new low while RSI creates a higher low; this indicates bullish divergence. Therefore, if you have a Hammer pattern, combined with bullish divergence in an RSI, this indicates that you have a high probability of seeing a reversal occur.
Do not rely solely on one candlestick pattern to identify a trade. While Hammers are indeed great candlestick patterns, they are not infallible. What gives you a better risk/reward opportunity for your trade is combining a Hammer pattern with an RSI divergence, in conjunction with having the Hammer pattern being located at a support level.
Breakout Strategies: ATR and Bollinger Band Squeeze
ATR (Average True Range) and Bollinger Bands are the two most common indicators used for breakout strategies. ATR measures volatility; therefore, volatility is very important when creating a breakout strategy. When the ATR is low, the market is coiled, and when the ATR increases, the breakout occurs.
You want to enter the market at the beginning of the expansion of ATR once it starts expanding from low levels. The Bollinger Bands also indicate when a breakout is occurring; when the bands are narrow, that indicates a low volatility period, and when the bands begin to widen, that indicates the beginning of the breakout.
By combining the ATR and Bollinger Bands, you have a timing signal (ATR rising) and visual evidence (Bollinger Bands widening) that indicates the breakout is happening.
Practical Indicator Selection
Professional traders do not crowd their charts with a plethora of indicators (most often between 5-10). Instead, they focus on 2-3 indicators that work together with one another to properly support and complement a specific trading strategy (rather than cluttering it with unnecessary indicators).
Examples of this would include a trend trader using only two indicators (the 50-day moving average and the MACD) and a range trader using two other indicators (the relative strength index and the Bollinger bands). A breakout trader may use two different indicators (the average true range and the support/resistance levels).
Think of it in the same way as using the correct tool for any job; you would never use a screwdriver to hammer in a nail, therefore, you would not use an RSI to trade trends or use moving averages to trade ranges.
So if you pair your indicators to your specific trading strategy, you will find that trading becomes much clearer and your overall trading results will improve significantly. Overall, using the proper tool for the correct job is extremely beneficial in making your trading more successful.
Common Mistakes & Strategy Optimisation
Despite having a good Forex strategy, many traders sabotage their success by making avoidable errors. A critical part of a successful trading strategy is knowing what mistakes you should avoid, just as much as using good-specific trading strategies will help lead to success.
Mistakes That Many Traders Make:
The first, most common mistake a new trader makes is overtrading. Many new traders think that the more trades they place, the more money they will make. This is incorrect. More trades mean more transaction costs and stress, plus, in most cases, they will lose the majority of their trades. Quality over quantity always wins.
The second biggest mistake a trader can make is blindly copying a successful trader's trading strategy without understanding how the strategy works or when to use the strategy. If you see a successful trader making profits using a breakout strategy, you may copy that strategy exactly without understanding what they are doing to exit the position and what type of risk management they are using. If the market suddenly changes, you would find yourself very confused and possibly lose a trade as a result.
Having no stop-loss order is similar to burning your trading account. Most traders believe that this time it will come back when they place a trade without a stop-loss. Sometimes they may get lucky, and it will come back; however, they may also find themselves down 500 pips very quickly and wondering how that happened. A trader should always use a stop-loss order.
Revenge trading will ruin your trading account. After losing a trade, most traders immediately go back into the market and try to get their money back. This type of emotional trading leads to further losses and often causes multiple losses, leading to a blown account.
Ignoring current market conditions is another trap many traders fall into.
Strategy Optimisation Through Backtesting
Backtesting is the process of verifying how successful your system would have been over time by using historical price data. The goal of backtesting your system is not to curve-fit your strategy or to find the best settings; it is to establish whether there is an edge in your trading approach.
As an example, you can take a breakout strategy on the EUR/USD currency pair. You could download all of the EUR/USD historical data from 2019 through 2023 and apply your breakout strategy. Now you can analyse the results of your strategy (i.e., the number of profitable trades, the percentage of winning trades, the average winning trade compared to the average losing trade, and how many consecutive losing trades occurred).
From your test results, you will learn whether or not your trading system is worth risking real money on. In addition, you will now know how much drawdown you could expect from your strategy if you hit a streak of losing trades. Many trading platforms provide the ability to backtest your system, so be sure to take advantage of this feature and backtest your system for at least 20 hours before you risk any real capital.
Demo Trading
Once you've completed your backtesting, it is time for demo trading. Demo trading allows you to practice in real time using “fake” money and executing your trading strategy in a live market as it unfolds.
Demo Trading will highlight problems in your trading strategy that you may not have noticed during Backtesting. You might discover that your trading strategy requires you to spend all day monitoring charts, but you work full-time. You may also find the emotional challenges associated with watching your trades evolve more significant than you anticipated.
I suggest you spend a minimum of 1-2 months Demo Trading to build confidence in your trading strategy and demonstrate that you can implement it consistently.
I like to think of Demo Trading as a trial run or practice game before you attempt to defeat your ultimate opponent. You do not go directly to the last level; you first practice, absorb the patterns, and develop your skills.
Dynamic Adjustments
Markets change, and there are times a strategy that did successfully in 2022 won't be as effective in 2024; Therefore, you must always review and adjust your strategy regularly.
Each month, you must look back at your trades. How many trades did you win? Have you taken larger-than-expected losses? Are there some currency pairs that haven't been working for you? Use that information to refine your approach through refinement of your strategy.
It may be that EUR/USD trends more favourably during certain months of the year or GBP/JPY tends to range more than previously thought; Therefore, adapt your strategy selection based on that information.
You will also need to adapt your risk to the results you are seeing recently. If you have been on a winning streak, perhaps it is worth taking on a slightly higher risk. Alternatively, if there has been a losing streak, you may want to take on lower risk. This form of dynamic risk management provides you with a form of protection for your trading account during long periods of lower performance and allows you to take maximum advantage of the opportunities available to you during profitable situations.
Continuous improvement is the goal of your trading efforts, not achieving a perfect outcome through trading. Over time, marginal improvements to a strategy can create significantly better trading outcomes due to compounding.
Global Market Applications & Real Case Studies
Every currency pair has unique characteristics that need to be understood and taken into account when developing Forex strategies.
The EUR/USD is the most liquid and, therefore, is the most frequently traded in the forex market for traders developing forex trend-following strategies. It also has a strong correlation with Central Bank actions and interest rate decisions, which is why using economic releases can help in formulating trend-following strategies based on this currency pair.
Major Currency Pair Characteristics
The GBP/USD is known for its volatility. It can move quickly, making it a great currency pair for traders using breakout and day trading strategies. However, because of its volatility, traders must utilise wider stops and a greater number of whipsaw trades when developing trading strategies using this currency pair.
The USD/JPY currency pair fluctuates with the perception of risk. When market participants are feeling optimistic about their investments, they will convert their yen into dollars, but in times of fear and uncertainty, the opposite is true. Due to this tendency and the tendency for the USD/JPY to oscillate around major psychological levels (110.00 and 150.00), traders have success with range and reversal strategies when developing trading strategies with this currency pair.
The AUD/USD and NZD/USD are examples of commodity currency pairs. These are currency pairs that tend to follow the same trends as the commodities they represent. Due to this relationship, commodity currency pairs tend to trend upwards when commodities are trending up, whereas they will remain at a flat, stable price during a period of flat commodity prices.
Regional Market Differences
The US trading session, which runs from 8:00 AM to 5:00 PM EST, has the greatest trading volume, and the majority of significant economic data releases occur at 8:30 AM EST.
News trading strategies will have the best chance to produce results during this time.
The European trading session (2:00 AM - 11:00 AM EST) will overlap with both Asia's early trading hours and the latter part of the U.S. trading session. During this session, most of the movement takes place with EUR, GBP and CHF pairs. As European traders establish a trend, trend following strategies tend to be effective.
Asia's trading session (6:00 PM - 4:00 AM EST) has much lower trading volumes and is characterised by relatively low volatility. The most active pairs during this session are AUD, NZD and JPY, and range-based strategies tend to work better due to low volumes and therefore, prices are contained within a narrow range.
Approximately 70% of all forex volume occurs during the London-New York overlap (8:00 AM - 12:00 PM EST). Due to the increased liquidity and tighter spreads during this time period, this is the ideal time for any trading strategy.
Real Case Studies
Case 1: EUR/USD Trend Strategy
A trader sees a bullish trend for EUR/USD in January 2023. A 50-day moving average has crossed above the 200-day moving average for 1.0500. There is bullish momentum in MACD, so they take a long trade for 1.0520 with a stop loss placed at 1.0450. Over the following three months, EUR/USD rallies to a price of 1.1000.
Each time EUR/USD creates a new higher low, the trader will raise their stop loss to below that higher low. Eventually, the trader will be stopped out at 1.0900 with a profit of 380 pips. It took the trader three months to achieve this profit from one trade.
Case 2: GBP/USD Volatility Breakout
GBP/USD was in a consolidation pattern for two weeks between the prices of 1.2600 and 1.2700 in March 2024. During that time, the Average True Range (ATR) reached its lowest multi-week value, and the Bollinger Bands were very tight. The trader placed pending orders to buy GBP/USD at 1.2710 and sell at 1.2590.
The price broke above the order for GBP/USD at 1.2710 on heavy volume. The trader was triggered to go long (buy), and GBP/USD went straight up to an extremely fast and profitable move of 120 pips within 48 hours, hitting 1.2850. The trader was able to close their position at 1.2830 with a profit of 120 pips. The breakout from consolidation offered a very fast and profitable move once initiated.
Case 3: Gold Reversal Strategy
In the month of August 2023, an individual noticed that the price of gold (XAU/USD) had risen from $1,800 to $2,100 over a span of a few months. A shooting star candlestick formed on the daily chart of gold at the price of $2,080. The relative strength index (RSI) indicated a bearish divergence on the price charts. The individual decided to enter a short position at $2,070, placing their stop-loss order at $2,095. Within the next 30 days, gold fell to a low of $1,950. The individual trailed their stop-loss and eventually exited the short position at $1,980 for a total profit of $90 per ounce. This confirmed their reversal strategy that identified the start of a significant downward trend.
Case 4:USD/JPY Range Trading
For the last three weeks of 2023, the USD/JPY currency pair has remained within the price range of 148.00 to 150.00. An individual used the RSI and Bollinger Bands indicators to execute trades within this range. The individual bought the USD/JPY currency pair when the RSI reached 30 and sold when the RSI reached 70 at these respective price levels.
During these three weeks, they purchased five times within the preestablished range, yielding an average return of 180 pips for every trade made. For the total 3-week range-bound period, the individual yielded a total return of 900 pips.
Adapting Strategies to Markets
The key to these examples is to use a strategy corresponding with the structure of the market and avoid forcing a strategy associated with trend-based markets on range-based markets (and vice versa).
Therefore, before the beginning of a weekly trading session, you need to evaluate your preferred trading pairs by assessing whether they are trending or ranging; whether there is high or low volatility in the markets; and whether either of those pairs is approaching a critical support and resistance area. Once you know these things, you can then choose the strategy that will allow you to be aligned with the current market conditions rather than working against them.
Every market presents unique challenges, so don't view this as a negative; take this as an opportunity. By becoming proficient at multiple strategies, you will have the ability to take advantage of any currency pair under every type of market condition.
Summary & Selection of Strategies
You've been introduced to all the different types of forex strategies used by expert forex traders, including but not limited to: following trends, trading ranges, day trading, reversal tactics, breakout strategies and risk management. Each of these is a tool you can add to your trading toolbox.
Instead of asking which strategy is best, ask yourself which strategy is appropriate, based on current market conditions, as well as your individual trading style.
Choosing Your Strategy
For trending markets: In trending markets, apply a trend-following strategy using Moving Averages and MACD. These methods are ideal when the ADX index is above 25, and prices are forming clear, higher highs or lower lows. The currency pairs EUR/USD and GBP/USD tend to trend quite well.
For ranging markets: In the case of ranging markets, you'll want to switch over to a range trading strategy using Bollinger Bands and RSI. You should wait until prices reach one of the range boundaries and then look for an RSI reading indicating overbought or oversold conditions before entering. While being patient during these periods may seem difficult, the consistency of profits will make them worthwhile.
For volatile breakouts: If trading a higher volatility breakout, breakout strategies using ATR combined with support and resistance levels should be employed. Look for situations where price coiling tightly and breaking out explosively provides a good opportunity to be positioned to ride that momentum.
For trend reversals: In trend reversals, use reversal candlestick pattern strategies, along with RSI divergence. While these strategies carry a higher risk, they may identify the onset of new or emerging trends at reasonable, strong support or resistance levels.
For short-term profits: For achieving short-term profit objectives, day trading provides opportunities to profit from small, intraday price moves without holding an inordinate amount of risk associated with overnight holding periods. Day traders actively monitor their trades throughout the day, while also avoiding the risk of gaps between the close of one trading session and the open of the next. Day trading provides daily profit results.
Risk Management is Non-Negotiable
Whatever strategy you select, proper risk management will keep you playing. Risk 1-2% per trade. Use stop losses. Properly size your positions. These things distinguish traders who will survive from those who will not.
When possible, use multiple strategies together. Use the daily chart for direction; the 4-hour chart for structure; and the 1-hour chart for timing. Use trend strategies when the market trends, or range strategies when the market consolidates.
Start with one strategy, and master it by backtesting and demo trading. Once you are consistently making money in demo, add another strategy to trade other market conditions, and slowly build your skill set.
Weekly review of your trades: What worked? What did not? Why? This is the feedback loop that accelerates your learning and improves your approach.
The forex market rewards preparation, discipline, and flexibility. You know, now it is time for you to execute.
Ready to put these forex strategies into action? Start trading on BTCDana.com with advanced tools, tight spreads, and a demo account to practice risk-free before going live.