




What Is the P/E Ratio?
The P/E ratio, or Price-to-Earnings ratio, measures how much investors are willing to pay for each dollar of a company's earnings. It is calculated using the formula:
P/E = Price / Earnings
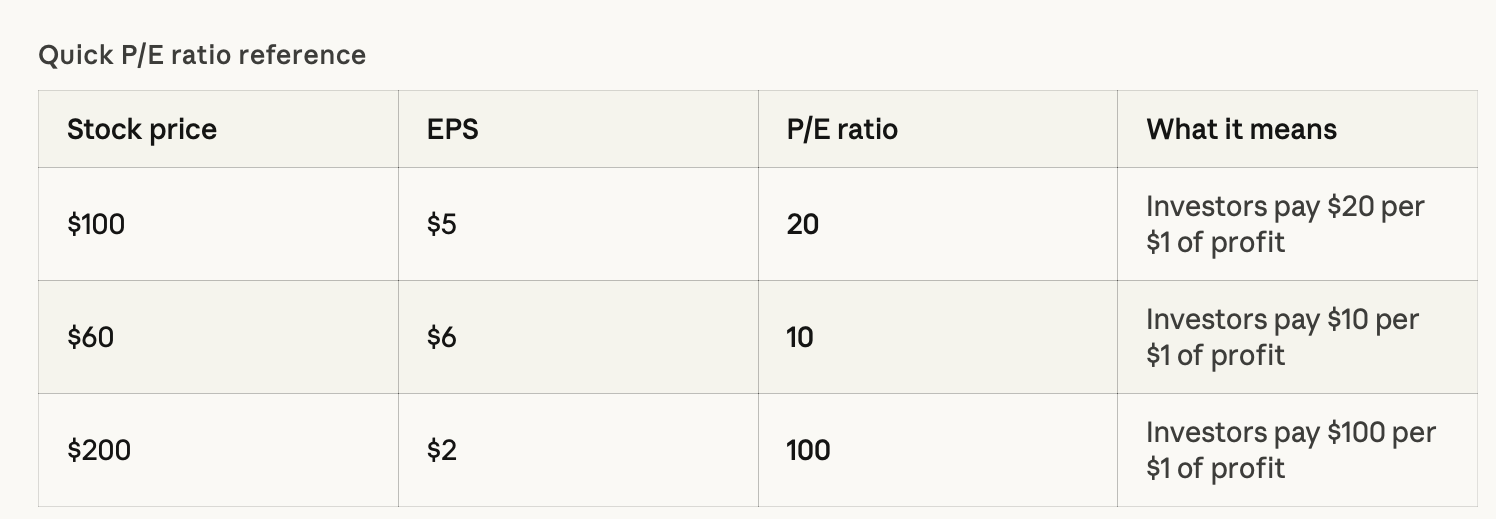
If a company's stock price is $100 and its earnings per share (EPS) are $5, the P/E ratio is 20. That means investors are willing to pay $20 for every $1 of profit the company generates.
Why Investors Always Ask About the P/E Ratio
From a Wall Street trader's desk to Reddit threads about stock pick conversations, always have at least one question asked, and that question is "What's the P/E ratio?" This has become the "universal" way to decide if a company is "cheap" or "expensive." It's found on stock screeners, brokerage platforms, and in the financial media, so it must be important, right?
It is simple enough to say "If the P/E ratio is low, the stock is cheap. If the P/E ratio is high, the stock is overpriced," so one would think.
To be fairthe , P/E ratio is the most utilised valuation metric around the world in equities, and there is a good reason why it's the most used. It converts the price of a stock to something more understandable than dollars.
However, while this P/E ratio is an important part of evaluating investments, a low P/E ratio does not necessarily mean it's a good value,e so please don't use this as your only metric without considering other metrics to help measure the valuation of your investments.
For example, a tech company may trade at a P/E ratio greater than 100 while a bank may trade at 10; both may have absolutely rational valuations as determined by the nature of their businesses.
This article will break down what the P/E ratio measures, where the P/E ratio can lead you and other ways to measure the valuation of your investments, such as PEG and CAPE and finally,lly how to measure your investments more completely. The P/E ratio is a starting point for analysis; it is not a complete analysis of your investments or the process you should use to determine if your investments are valid or not.

What Is the P/E Ratio? A Simple Explanation
The pe ratio formula itself is refreshingly simple: divide the current stock price by the company's earnings per share. Price divided by earnings gives you a multiple, and that multiple tells you how many dollars investors are paying for every single dollar of annual profit.
P/E = Stock Price / Earnings Per Share (EPS)
If shares of Company A are selling for $100 each and that company earns $5 per share each year, then Company A has a price-to-earnings ratio of 20. So when an investor purchases that stock, they will be paying $20 for each dollar of profit Company A makes each year. The rationale for this number is related to confidence in the future and how long it will take to get back your initial investment. The higher the P/E ratio, the longer an investor will be willing to wait for a return on their investment.
Think about a hypothetical coffee shop owner who buys a coffee business for $200,000 that produces $20,000 in profits each year. The coffee shop owner is paying a P/E ratio of 10 to purchase this small business. It would take the coffee shop owner 10 years to recover the $200,000 purchase price through profits alone. The same logic applies to a company with a P/E of 10.
Compare two real companies together as a benchmark: historically, Apple trades between 25 and 35 times earnings ratio because it consistently earns more year after year; there is great confidence among investors in Apple's ability to grow. On the other hand, Tesla trades well above 100 at different times because investors expect Tesla to have rapid growth in its operations, versus having to rely on current profitability to support Tesla's stock price. These numbers are not apples-to-apples comparisons due to the different nature of businesses between Apple and Tesla.
A price/earnings ratio reflects how much investors are willing to pay today to buy tomorrow's stream of profits.
The P/E Trap: Why a Low P/E Can Mislead Investors
Many value investors mistakenly believe that a low P/E ratio means that a stock is undervalued. Seasoned investors know this to be a value trap that impacts a substantial number of otherwise intelligent individuals.
A low P/E ratio could be an indication of a stock trading at a discount to its true worth; however, a low P/E could also be the market's way of alerting that the company will see a substantial decrease in future earnings compared to the current level of earnings. If the market has discounted future profits significantly downward, then the calculation of P/E using last year's earnings results in an artificially low ratio.
Two examples of cyclical industries are the oil and mining industries; both experience extraordinary profitability during commodity price booms. At the height of an oil price cycle, many energy companies report record-long profits and very low P/E multiples, prompting investors to purchase these perceived bargain stocks. When commodity prices decrease, the severe decline in profitability will trigger a corresponding increase in P/E ratios, nullifying the bargain stock characteristics of such companies.
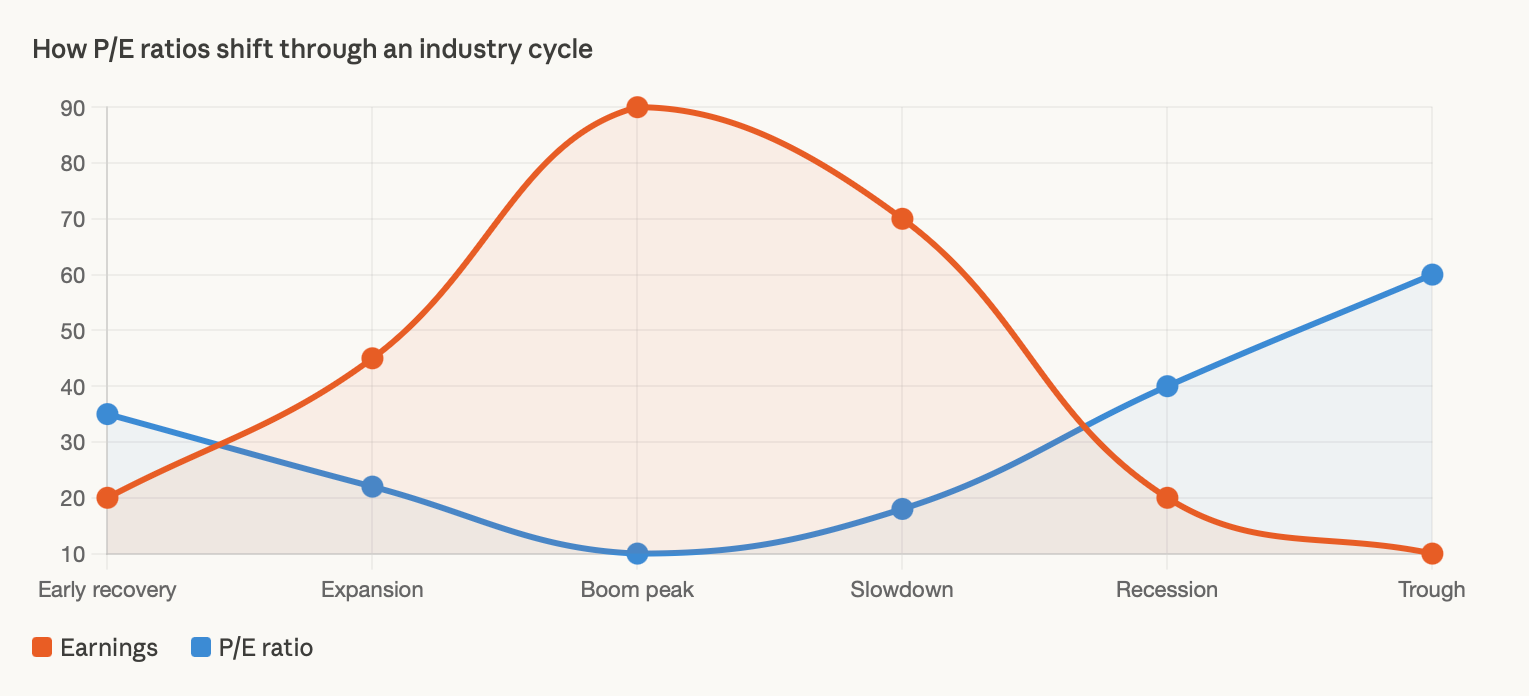
Here's another way to explain the same thing:
If a restaurant made a profit of $100k and had a P/E ratio of 10 because of it, that's considered to be a great thing. However, if next year the restaurant only makes $20k in profit because of competition and neighbourhood changes, then the P/E ratio will no longer be low, but the reason why is much different this time.
What is important about the example above is that the markets are looking at what may happen in the future and not just what happens in the past. Therefore, while the P/E may indicate that a company has high profitability based on current profits, the inverse of that P/E is also true. A low P/E indicates that future earnings expectations mix low risk, and that is where value investing has made a mistake by disregarding that factor.
Why Different Industries Have Very Different P/E Ratios
Retail investors frequently err by comparing P/E ratios between industries. For example, asking if Nvidia has a higher price than JPMorgan because of their respective P/E ratios is similar to asking if a race car would cost more than a delivery truck simply because of fuel consumption. It would be impossible to compare these two companies structurally, so there is no way that their valuations can be compared, since the basis for each of the valuation methods is entirely different.
Technology companies usually have higher P/E multiples for many reasons that work together. For example, growth rates of technology companies are significantly higher than the overall economy.
Software companies typically have near-zero marginal costs to produce one additional software license, which means that, as their revenue increases, their profitability will increase very rapidly due to the increased gross profit margin from higher revenue compared to the fixed costs a company has.
Additionally, the presence of network effects creates winner-take-most dynamics whereby the leading technology platforms increase in value over time. These factors will cause investors to value the technology sector at a better P/E multiple.
Financial institutions use a different business model to make a profit. Banks earn their profits from the difference between the rates they pay for deposits and the rates they charge for loans.
Because banks generate interest income through this process, their interest income is relatively stable, and their ability to grow their interest income is limited due to regulations. Therefore, the P/E ratios for banks reflect a slower and more stable economy than that of technology companies.
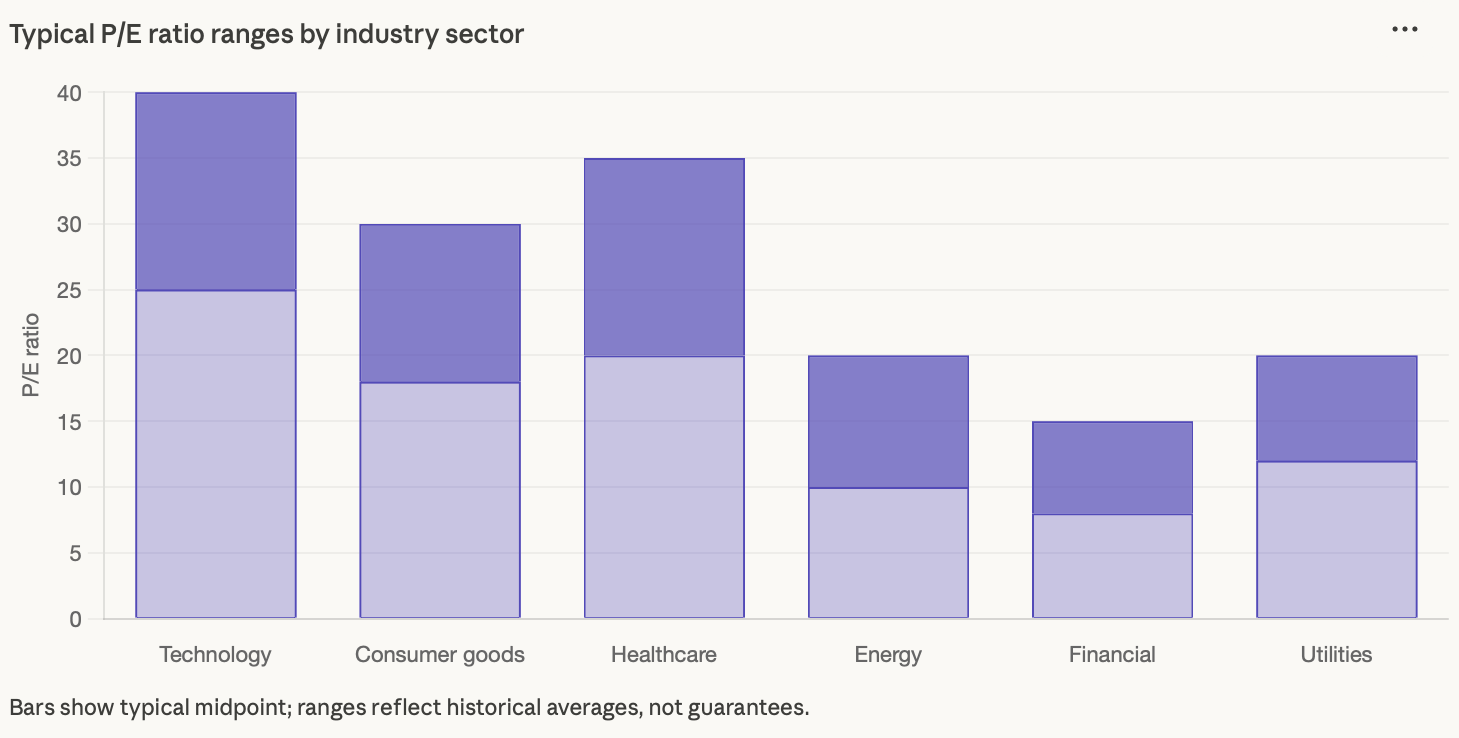
The fact that commodity prices fluctuate greatly and are out of the control of management, and two, because oil and gas reserves are depleting and are therefore not growing businesses like the rest of the companies in the industry. Because of these two reasons, the markets have built in a discount to the stocks of these companies, giving them a lower multiple.
The best way to compare companies by using the pe ratio is to look at how the company compares to its own historical average pe ratio and how it compares to other companies in the same sector.
So, for example, a bank that is trading at a pe ratio of 8 when the average for its sector is 12 could be a very good value; however, a software company with the same absolute number is most likely a sign that something is very wrong.
PEG Ratio: A Smarter Way to Adjust P/E for Growth
The P/E ratio has a structural flaw: it ignores growth. A company growing its earnings at 5% per year and a company growing at 40% per year look similarly expensive if they share the same P/E, but clearly, they're not equivalent investments. The PEG ratio fixes that problem by incorporating growth directly into the valuation calculation.
PEG = P/E ratio / Annual EPS Growth Rate
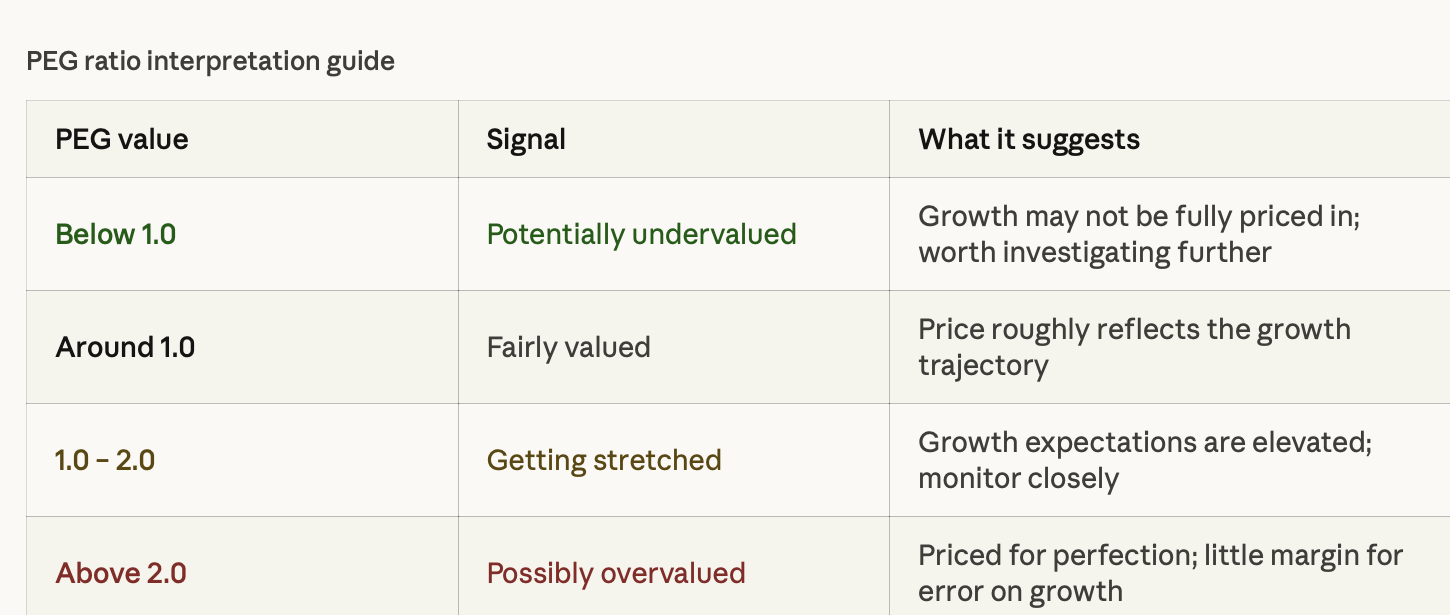
If a company has a P/E of 40 and its earnings are growing at 40% per year, its PEG is 1.0, which most analysts consider fair value. A PEG below 1 suggests the stock might be undervalued relative to its growth rate, while a PEG above 2 raises questions about whether the current price already reflects too much optimism.
During different periods in Amazon’s history, its price-to-earnings (P/E) ratio has appeared unrealistic because it has continuously chosen to reinvest nearly all of its earnings into expansion.
This has led many investors to incorrectly perceive that Amazon was grossly overvalued by using only P/E to evaluate the stock; however, those who looked at revenue growth, potential to earn in the future, and PEG-related metrics understood that, although currently overvalued, Amazon was building something with earnings potential that would one day catch up to its stock valuation.
The PEG ratio is not without its faults, as it depends on some estimate of growth, which is an unknown, and depending on the analyst, the growth rate can be either a trailing or forward-looking growth rate, thereby creating a situation where an investor has no clear view of the company's future earnings potential.
However, PEG is a better way to help an investor evaluate companies with high multiples than using only the P/E method because it illustrates a clearer picture of the company's true value as a growth stock.
CAPE Ratio: Understanding Market Valuations Across Economic Cycles
Economist Robert Shiller from Yale created the Cyclically Adjusted Price-to-Earnings Ratio (CAPE) in order to address a concern about the standard P/E ratio, whereby earnings from one year may be greatly affected by whether the economy experienced a boom or bust at that point in time. CAPE averages ten years of inflation-adjusted earnings to smooth out cyclical swings, thus providing a much longer-term analysis as to whether markets are valued below or above historical averages.
CAPE became popular, and possibly infamous, in the late 1990s when Shiller noted that the US stock market was currently overvalued using this metric. CAPE rose to over 40 during the dot-com bubble, a level well above any historical precedent. After the market correction, we can see that Shiller was spot on about the state of the market, but we still could not predict when it would occur.
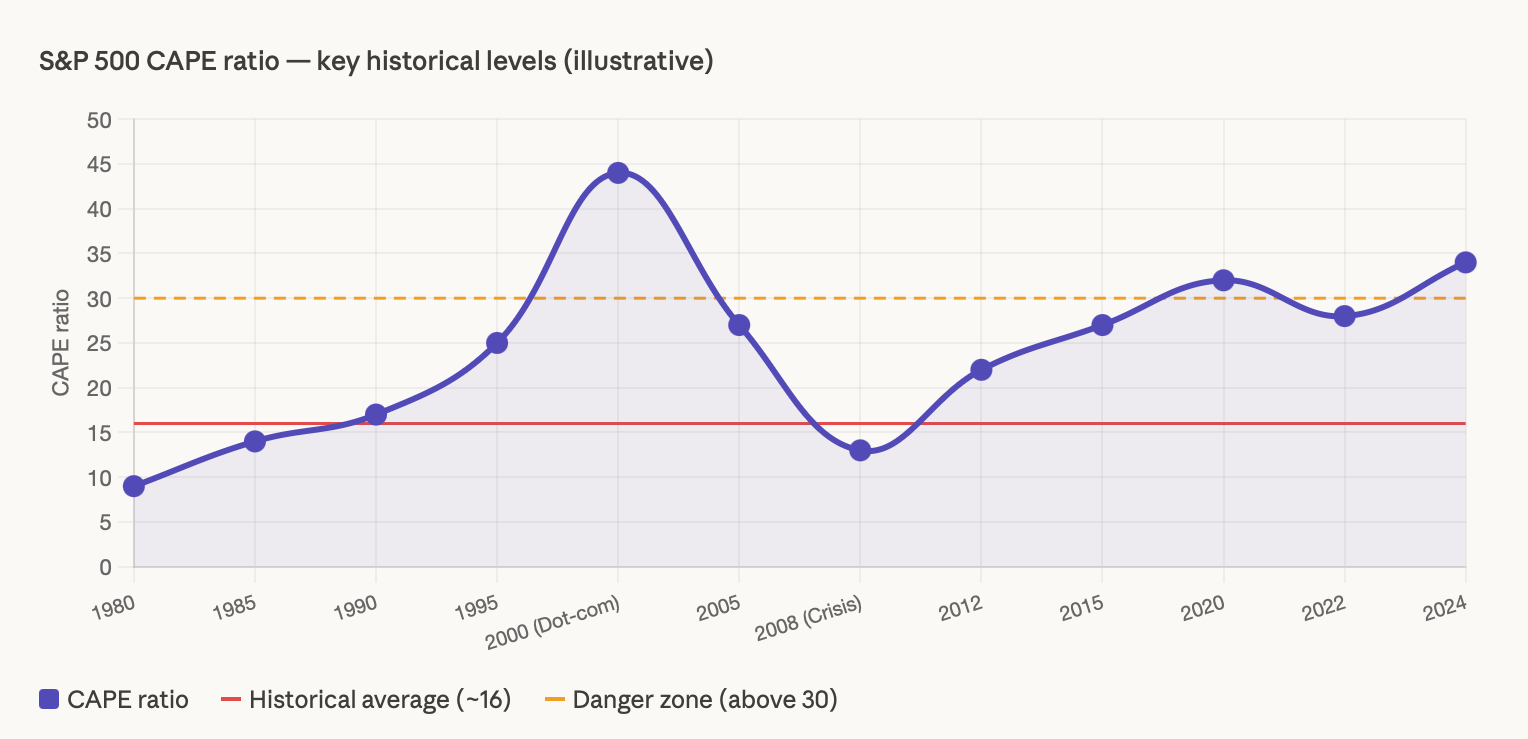
The CAPE ratio fell a lot in value during the 2008 recession because both stock prices and earnings fell, and historically, periods of low CAPE would correlate with better long run returns for an investor who bought into those low valuation periods.
While the CAPE ratio does not give an exact timing prognosis for when the stock market will rise or fall, this financial measure does provide a very dependable sense of whether you are purchasing shares in stock markets that are on the whole, undervalued and overpriced compared to their historical average earnings.
One of the major limitations of the CAPE ratio is that it provides a better macroeconomic level analysis than it does a stock specific signal for purchasing stocks. Therefore, the CAPE ratio is best used to determine whether the market as a whole (e.g., S&P 500) is overvalued or undervalued compared to historical averages or averages among all of the companies represented in the S&P 500. The traditional P/E ratio, Growth stock, and industry-specific metrics are superior measures of whether an individual company's shares are overvalued or undervalued.
How Traders and Investors Use the P/E Ratio in Real Strategies
Long-term value investors typically screen for companies that have P/Es that are below their historical or sector levels, based on the premise that when bad news causes the markets to overreact, it will also negatively impact the P/E ratios of fundamentally sound companies, creating a chance for long-term investors to acquire shares of equity at a lower price.
Conversely, growth investors take an opposite approach and look for companies with accelerating earnings while using a higher P/E multiple to acquire the company's stock. They believe that as the company's earnings continue to grow, the elevated P/E will eventually be justified, leading to an increase in the company's stock price, even if the P/E remains unchanged.
On the other hand, traders have completely different relationships to P/Es, specifically with respect to the concepts of multiple expansion and contraction. Oftentimes, when the stock price only increases due to the fact that there is a higher demand for shares with the same earnings, the increase has nothing to do with the company's fundamentals.
During bull markets, for example, the P/Es of technology stocks will often increase substantially without an increase in the company's earnings. However, during bear markets, the P/Es will often decrease even when the company's earnings are stable, which will cause the stocks to decline.
Being able to understand the distinction between the two forms of price increases created by earnings growth or multiple expansion will allow you to properly analyse the price changes occurring in either direction, allowing you to manage the risk associated with your position.
Crypto Valuation: Metrics That Replace the P/E Ratio
Many projects in the crypto space don't generate earnings like public companies, so using the P/E ratio as a method for assessing value is either impossible or meaningless. However, blockchain networks and decentralised finance protocols generate measurable economic activity, which analysts have adapted to similar methods used in valuing traditional equities.
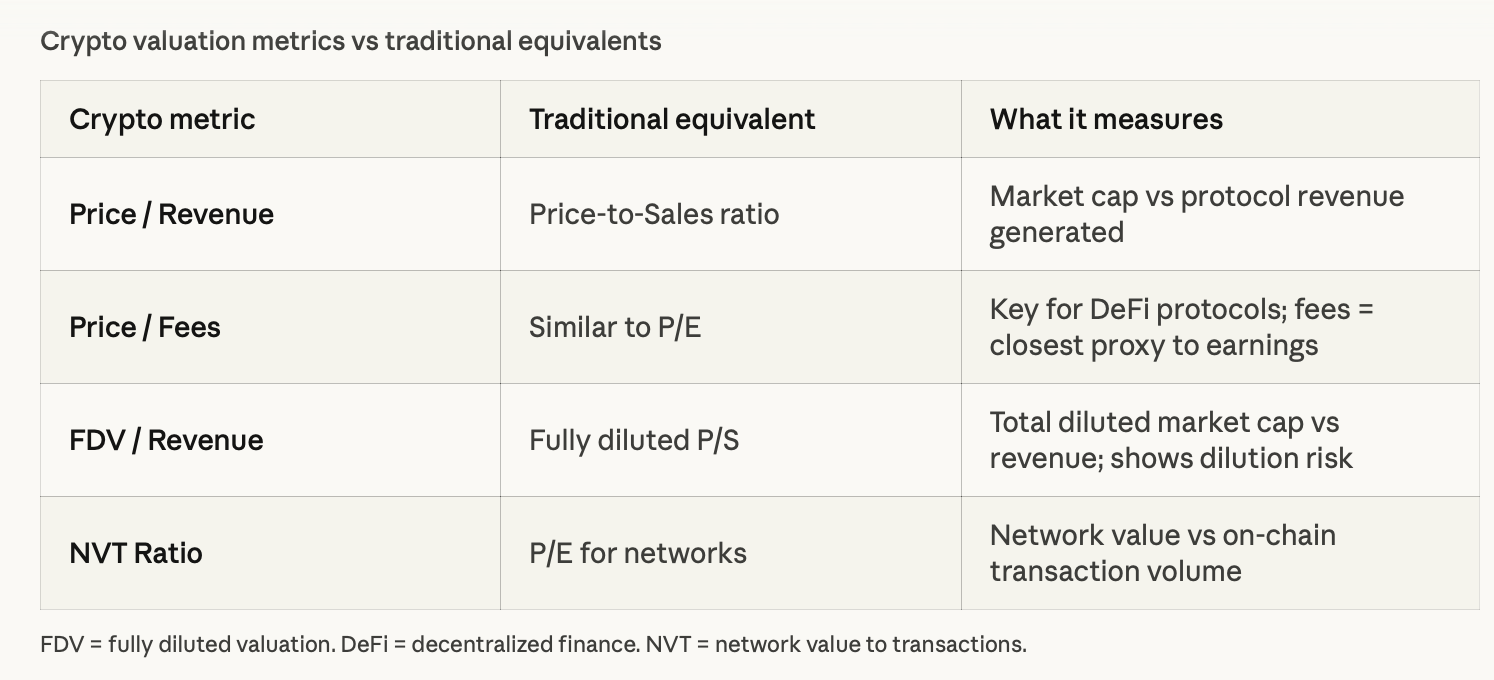
The Price-to-Fees ratio serves as an analogue to the P/E ratio, particularly in DeFi protocols. For example, if a lending protocol has $10 million in annual fees and a market capitalisation of $100 million, its P/Fees ratio would be 10 and could be compared to other DeFi protocols that compete in the same category. The basis for valuing the protocol would be the same as for analysing traditional equity, even though the asset being valued is a token on a blockchain instead of a stock certificate.
In summary, the concept of valuing assets is not eliminated in cryptocurrency markets; rather, it is modified to fit those markets. Therefore, if you are an investor who can apply valuation structures from the traditional financial markets to blockchain projects, you will have a valuable analytical advantage over a retail investor who does not apply any valuation structure at all when making decisions about which cryptos to invest in.
Smart Investors Don't Just Hunt for the Lowest P/E
The p/e ratio is the centre of the investment analytical universe because it converts the abstract concept of a stock price into something that is both intuitive and comparable. It is available, easy to calculate, and provides an almost instantaneous view of how the market is valuing a company’s earning potential. These attributes make it very valuable.
However, it is at this point in the analysis that one starts to underperform; namely, when low p/e ratio stocks are not automatically considered ‘cheap’ simply because they may be a reflection of a declining business or cyclical peak earnings. Similarly, high p/e ratio stocks should not necessarily be viewed as ‘expensive’ simply because they represent a legitimate business trend that may take time to develop an earnings history. The different industries have their own valuation norms; comparing across different industries will often lead to more misleading than helpful conclusions.
PEG ratio adjusts for growth, which is overlooked by the original p/e ratio and makes this measure much more useful in evaluating companies within growth industries. CAPE ratio adds the component of economic cycle and long-term earnings history, thus making it appropriate to use for determining whether broad markets are relatively cheap or expensive when looked at over the long-term. Together, these three metrics provide a much clearer picture than what would be available from any of them individually.
The P/E ratio provides the initial basis of investment analysis; to achieve consistent profitability o, one must always go beyond that initial basis!
Explore real-time crypto valuation metrics, on-chain analytics, and market cycle signals at btcdana.com