




What is Commodity Trading?
Commodity trading involves buying and selling raw materials such as gold, oil, agricultural products, and metals. Traders access these markets through physical holdings, futures contracts, ETFs, or CFDs, using them to hedge against inflation, speculate on price movements, or diversify a portfolio across uncorrelated assets.
When inflation is rising across the globe, many investors start to question where they should invest their money, as the currency they are holding is likely to continue losing value in terms of purchasing power. The inflation peaked in 2022 and 2023, and many consumers had seen inflation at levels that had not been experienced since the early 1980s.
Traders in commodities have long-term historical evidence to show that commodity prices typically follow the same trends as inflation when compared to the Consumer Price Index (CPI), as represented by the CRB Commodities Index, which shows the same trends in inflation across the developed world. Experienced traders know this; therefore, they take cover in commodities when their currency is losing value, and therefore, commodities are not losing value when compared to paper currency.
The information contained in this guide will help you formulate a commodity trading strategy to benefit from inflation in 2026. This guide will cover an understanding of the macro-economic forces behind price fluctuations for commodities, as well as provide tactical information related to inventory reports, leverage management, and seasonal opportunities versus your competition in the market.
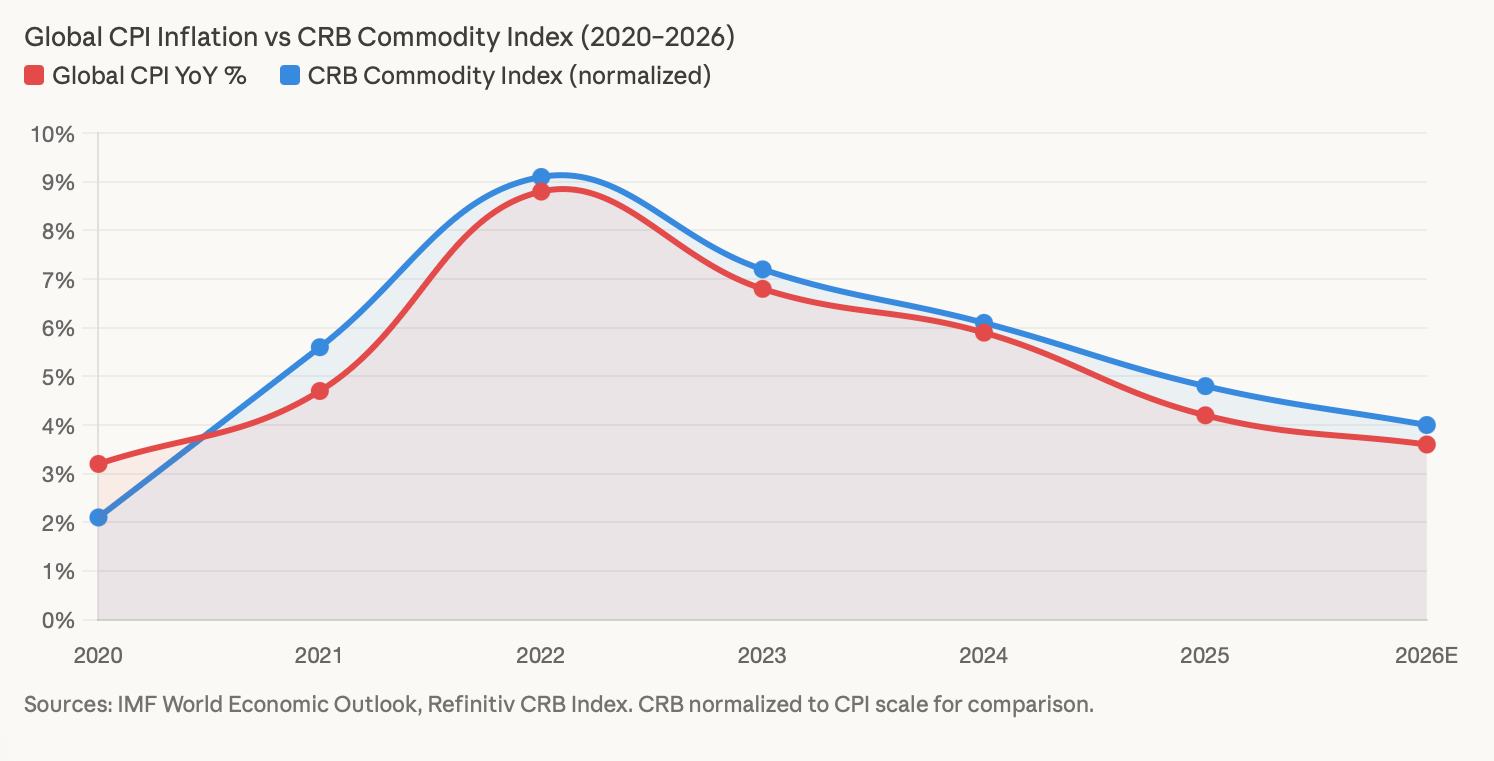
The chart above maps global CPI inflation against the CRB Commodity Index from 2020 through 2026, and the relationship is hard to ignore. When inflation ran at its peak in 2022, commodities were delivering some of the strongest returns across any asset class.
Why Commodity Trading Is the Best Inflation Hedge in 2026
Prices for food, fuel, and rent all increase over time. By the time the average investor recognises inflation is affecting their purchasing power, it has already had an adverse effect. The mechanics are rather simple; Central Banks are creating more money than can support the growth of the economy, which reduces the value of each dollar.
While there is a corresponding rise in the value of commodities when inflation occurs, commodities are tangible assets with real-world uses and limited supply. Unlike government bonds, commodities do not have an interest rate, so their value does not decrease when inflation increases relative to the dollar. Likewise, commodities do not rely on a company's profits to maintain their value; they exist and will increase in value as the dollar weakens.
If you look at the CRB index over the past five years and compare it to the CPI over the same time frame, you will see a correlation. The spike in oil prices to over $120/barrel during the second half of 2022, despite large losses in the equity markets, is indicative of the correlation between commodities and inflation. Additionally, copper prices increased in early 2022 in anticipation of a global supply chain crunch.
For a professional who manages an investment portfolio, the relationship between inflation and commodities is not surprising. A professional uses commodities to hedge against inflation. Those who recently became investors should consider the examples above to understand this.
If you owned physical gold in the form of a gold ETF, like GLD, through the first 6 months of 2022, the amount you paid to acquire it will have increased in value at approximately the same rate as the CPI. Your purchasing power was retained during the period when cash savings due to inflation were diminished.
You can benefit from this hedging strategy by owning physical commodities, futures contracts, ETFs, or CFDs with smaller upfront capital requirements. Each strategy has different costs and risks associated with it, which we will review in detail in the strategies section below.
Top Commodity Trading Strategies: How to Profit in 2026
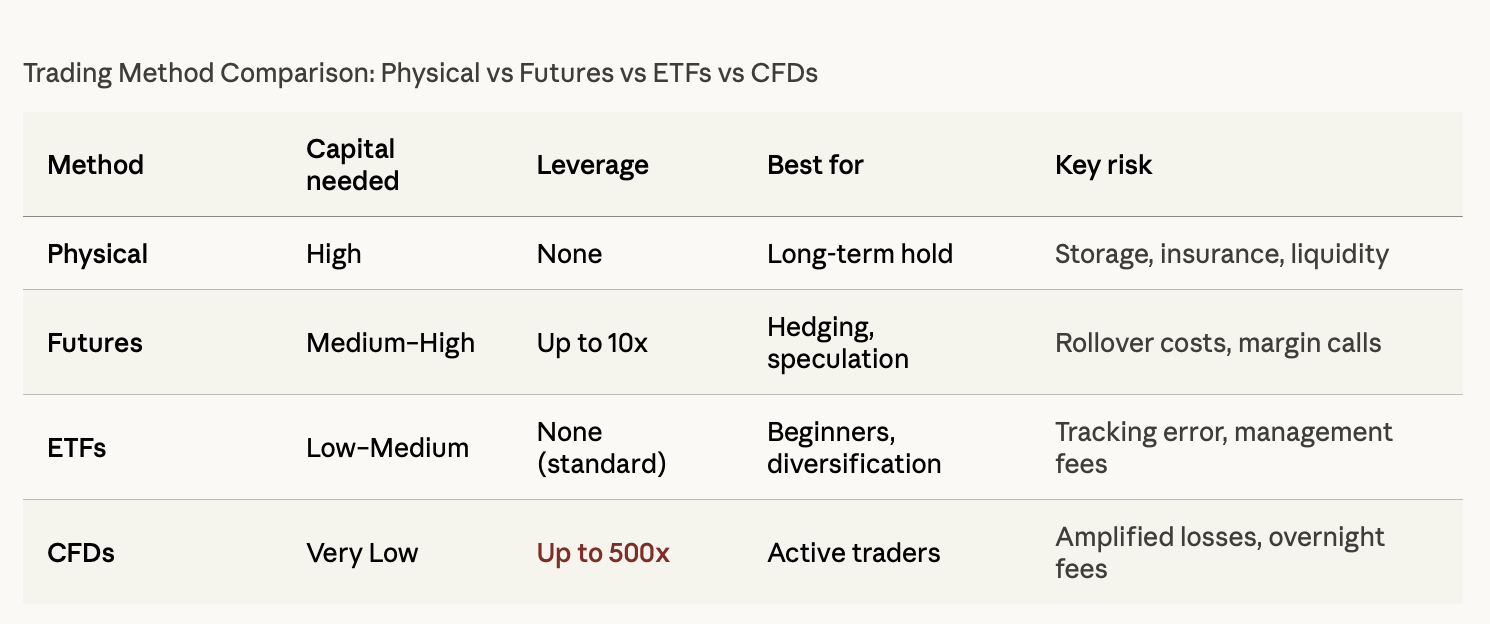
The comparison table above outlines the four main trading methods based on the main metrics that matter: amount of capital needed to start trading, availability of leverage, what each method is best used for, and the main risk associated with each method. It is worth looking at these dimensions before deciding on one method, as each is geared toward a specific investor profile and objective.
If you will be investing using these four methods, each investor's profile will clearly define whether you should invest through physical gold or an ETF for long-term holding. If you are looking for inflation protection and are not interested in actively managing your investment, then you would want to invest through one of these two methods.
Holding physical gold or silver during an inflationary period is conceptually straightforward; however, storage and insurance can be a minor cost in getting started. GLD is the largest gold ETF, and it will offer you the same price exposure with your investment in the stock market through a brokerage account while eliminating the logistical issues involved in this process. The same goes for USO, which provides you with a means of investing in the WTI crude oil price.
Futures contracts are an asset class that is primarily designed for experienced traders with an understanding of contango and backwardation. If you are trading in the contango market, you will find that you'll be paying a premium for your purchase of crude oil via futures contracts because the price of futures contracts will be priced above the spot price of crude oil.
This will create additional costs of doing business because of the cost to roll your futures contracts forward as contracts expire, which will have an eroding effect on your overall returns if the market remains in contango. A trader in backwardation will also realise that he is trading at a discounted rate to the spot price, which can be helpful because it generally indicates that there is a supply issue related to physical crude oil.
If you are a trader using gold in the futures market to hedge against inflated losses in a fixed-income portfolio, you could do so in a deliberate way rather than using futures to speculate on an increase in gold prices.
ETF investing represents the easiest way for most traders to develop a diversified commodity portfolio without the complexities associated with using futures to accomplish that same objective. Those reasons include that this diversification can smooth out the volatility associated with the specific asset classes contained within the overall commodity space.
For example, energy prices respond to geopolitical uncertainty, agricultural products respond to varying weather patterns, and precious metals respond to varying interest rates. By holding a diversified basket of agricultural products, you can limit your exposure, but at the same time maintain a hedge against inflation.
CFD trading through a platform such as BTCDANA would be able to establish a position in crude oil, gold or any other of the primary commodities for a fraction of the amount of money it would cost to do so by using a futures contract. This makes it easier for individuals with smaller trading accounts to trade, but because it is a highly leveraged transaction, it increases the chances of loss significantly.
For example, a 10x leveraged position in crude oil will lose 50% of the margin you invested if crude oil moves 5% against you, and additionally, you will be charged overnight interest daily for the leveraged contract you are holding.
CFDs provide a highly efficient means for any trader with a specific technical view of the price direction of a commodity over a defined timeframe, but they are not designed for passive inflation hedging.
How Macroeconomic Trends Drive Commodity Trading Success
Commodities traders must learn from the macro chart shared at the beginning of this post; as shown in the chart, Fed rate increases impact not only the yield on bonds or value of stocks but also flow efficiently into all commodity markets with a degree of predictability.
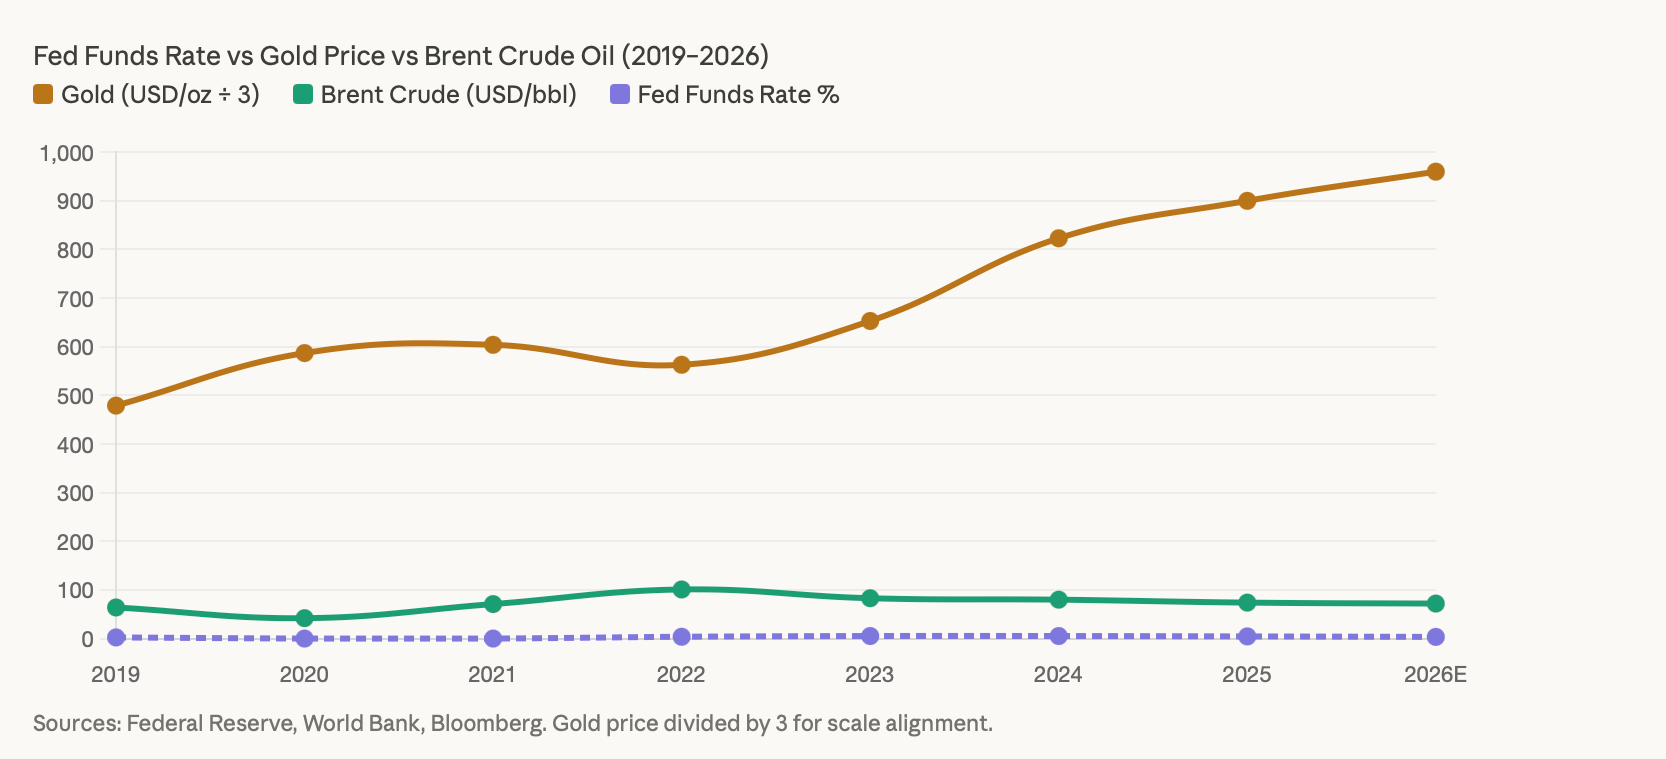
The link between interest rate levels and commodity prices flows through two channels. The most obvious is that an increase in interest rates would increase the strength of the dollar. This is because capital flows to the USD for investment would be greater than they would otherwise be.
Since commodities are priced in US dollars, this makes them more expensive to other currencies and will reduce demand for them relative to their pricing, thus pushing their prices lower.
An increase in interest rate levels raises the total "cost" of holding a nonyielding asset like gold by creating a higher opportunity cost and making bonds look more attractive; this will lessen the attractiveness of holding gold as an asset or store of value.
The 2022 cycle of rate raises occurred primarily as expected, except that while the Fed raised rates more than they anticipated g,old prices mremainedat approximately $1800 an ounce due to continued high expectations for inflation, which kept real rates negative or nearly zero; therefore, the rotation out of gold was not as forceful due to the lack of a significant opportunity cost.
For oil, the macro environment is more directly connected to economic growth than interest rates; therefore, as the Fed raised rates and slowed the overall economy, a decline in demand for oil followed. Conversely, when the Fed's actions do not provide the desired slowing effect, continuing to provide growth results in continued demand for oil across all economies.
The events of 2023 showed that this provided a good example, as OPEC cut production to offset demand declines from rate hikes while crude prices stayed above $80 a barrel for a good part of the year, despite the overall decline of the global economy.
While an understanding of the above connections does not guarantee successful predictions, it does provide an organised method for interpreting the economic data as it gets released.
For example, if the US releases stronger-than-expected jobs numbers, the Fed may be more heavily influencing its monetary policy over a longer time frame as a result of the less clear but greater overall positive economic activity associated with increased demand for both oil and industrial metals in a growing economy.
Unlocking Commodity Trading Secrets: Seasonal Patterns and Futures Term Structures
The seasonal chart above captures something that gets underappreciated in most commodity discussions: commodity markets run on natural cycles that repeat with enough consistency to be tradeable.
Understanding these patterns doesn't mean you can ignore fundamentals, but layering seasonal timing on top of a fundamentally sound macro view sharpens your entry and exit decisions considerably.
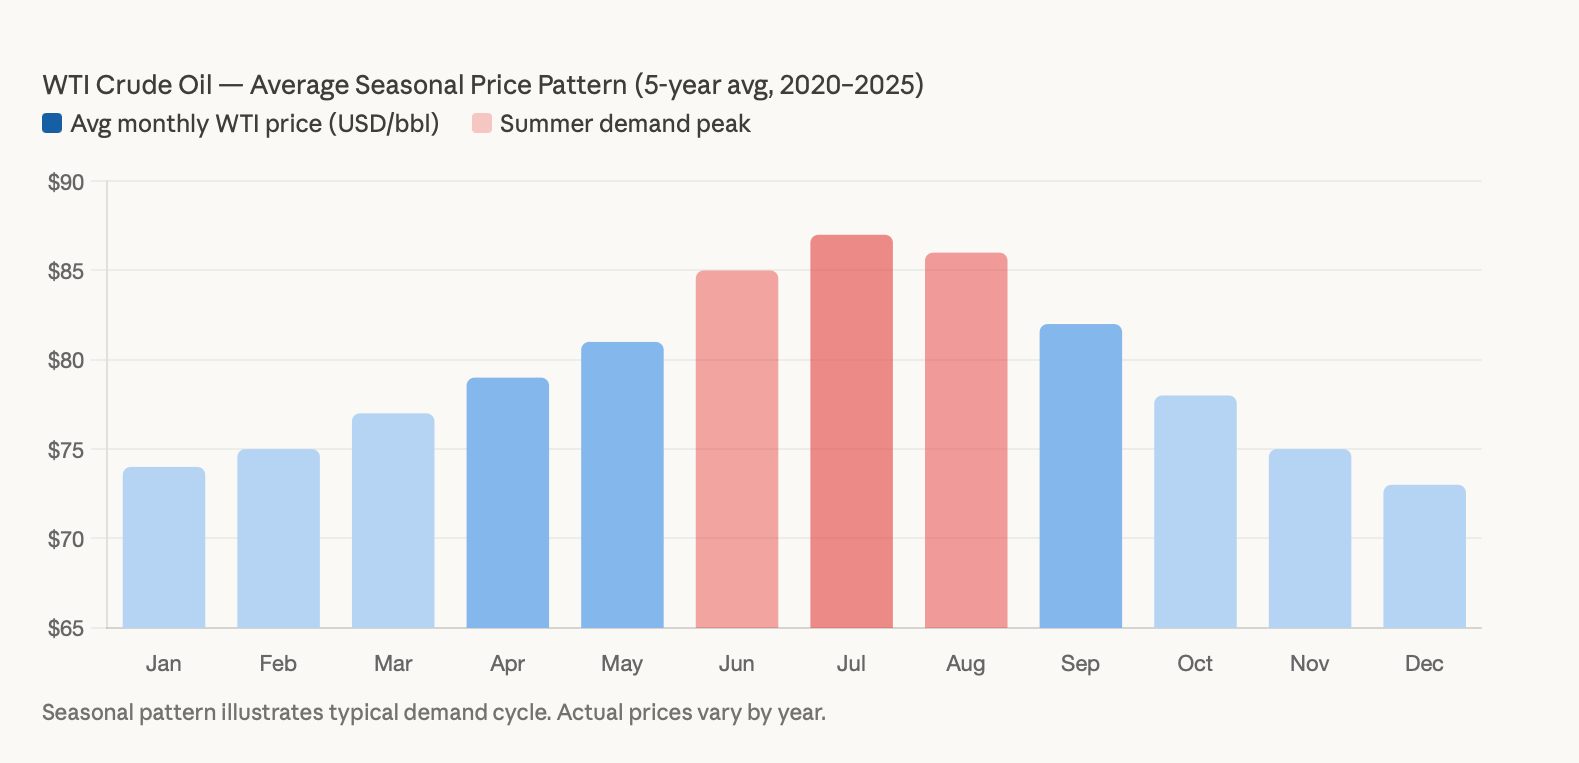
WTI crude oil follows a demand-driven seasonal pattern that has held broadly consistent across multiple years. Gasoline demand peaks during the summer driving season in North America, pulling crude oil prices higher between late spring and early August.
Refinery maintenance shutdowns in early spring and early autumn temporarily reduce crude demand, creating brief softness. Heating oil demand picks up in late autumn, providing another seasonal tailwind heading into winter. For a trader who already has a fundamentally bullish view on oil, entering a position in April or May and targeting a summer exit captures this seasonal dynamic efficiently.
Agricultural commodities follow harvest calendars that are even more mechanically predictable. Corn and soybean prices typically soften during and immediately after harvest, when supply floods the market, then recover as inventories draw down through the following spring.
A beginner-friendly way to think about this: if you're buying corn futures in October, you're entering at a point when prices are seasonally depressed, with natural recovery built into the calendar ahead of you.
Futures term structure analysis extends this toolkit. When a commodity's futures curve slopes upward sharply, it usually signals that the physical market is well-supplied and storage is being used, which isn't a strong buy signal.
When the curve flips into backwardation, meaning near-term delivery commands a premium over forward delivery, it signals that physical supply is tight relative to immediate demand, which has historically preceded sustained price rallies.
Combining a backwardated market structure with a bullish seasonal period and a supportive macro backdrop gives you a layered case that's far more robust than any single indicator alone.
How USD and Real Interest Rates Affect Commodity Prices
The DXY/Gold chart clearly illustrates the inverse correlation between DXY and Gold. In 2022, when the DXY had a large upward move, this brought about a corresponding fall in the price of gold as well (from $2000/oz to ~$1630/oz). After the market had reached its peak expectation for Fed Funds Rate, the DXY peak, and the market turned down at the end of 2022, the price of gold began to recover and eventually set a new all-time high in 2024 above $2500/oz and continued to move higher through 2025.
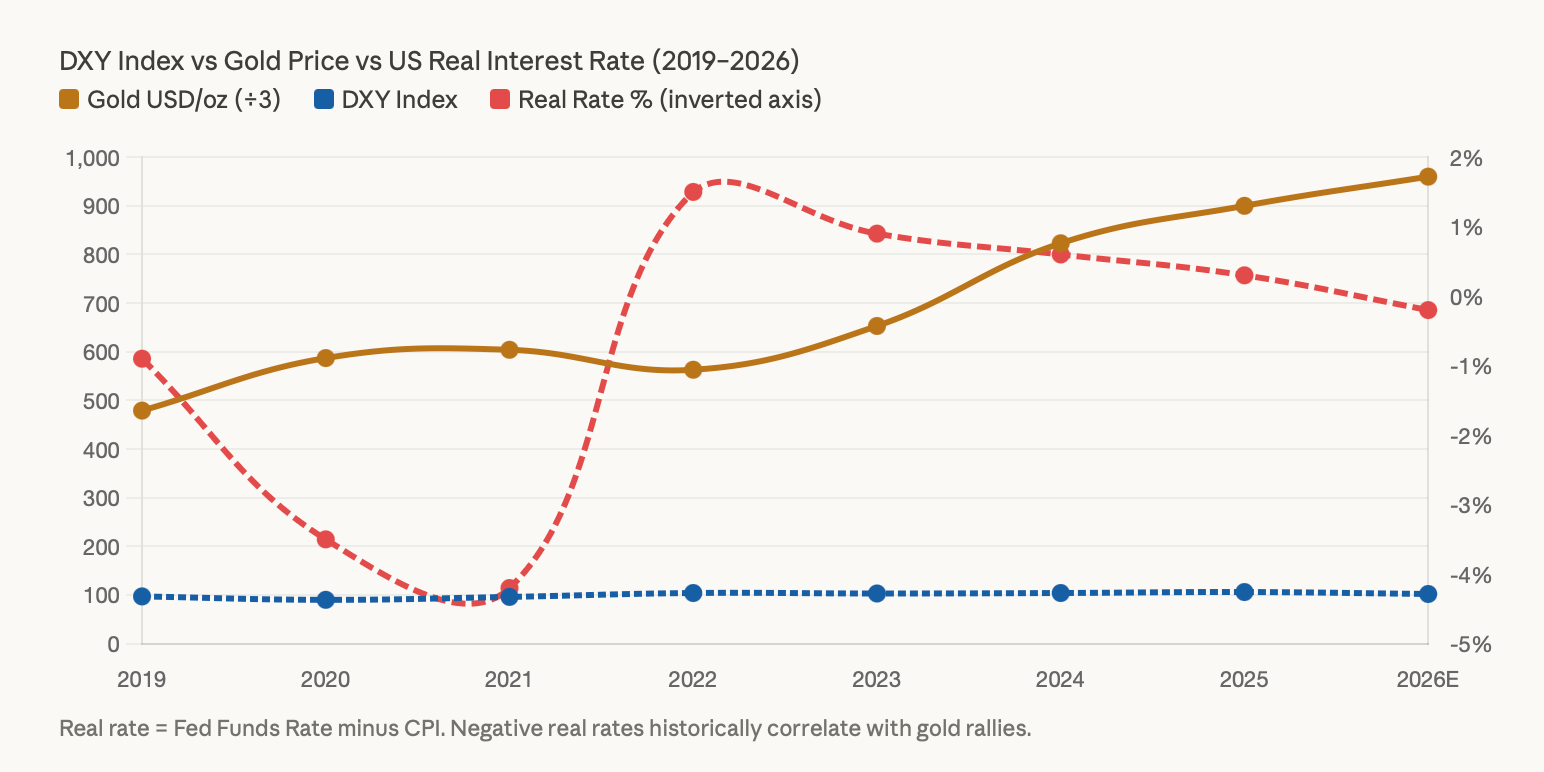
Real interest rate is a more exact measure for gold traders when calculating real opportunity cost.
Real Interest Rate (RIR) = nominal Fed Funds Rate – inflation expectation (generally captured by 10 Year Breakeven Inflation Rate).
A negative RIR means that you are actually paying nothing in relative terms for holding gold versus holding cash. When real rates are deeply negative, the relative value of holding gold has never been better due to the horrible relative returns on alternative investments.
With crude oil and ag commodities, the relationship between USD and these commodities is mainly driven by trade flows rather than relative opportunity cost. When the USD weakens, commodities priced in USD become cheaper for foreign purchasers of these commodities who transact in currencies other than the US dollar, resulting in a marginal increase in demand for these commodities.
The majority of crude oil demand is supplied by Asia and Europe, and as their currencies strengthen against the USD, their importation of crude oil increases and subsequently supports the price of crude oil.
Incorporating dollar trend analysis into your commodity trading strategy does not require you to develop any elaborate projects or models. You can simply look at DXY and evaluate its trend direction to develop a first-order filter for your positioning across the commodity markets.
Historically, when the Fed has completed or is nearing the completion of a hiking cycle and the DXY has reached its peak, that is when building commodity positions has produced the highest risk-adjusted returns.
Geopolitical Events and Energy Transition: How They Shape Commodity Trading Opportunities
Two major forces are shaping the narratives of the commodity markets as we enter the second half of the 2020s, and both of these forces are providing long-duration trading opportunities extending well beyond any one quarterly cycle.
The first of these forces is geopolitical. The geopolitical risk premium embedded in oil prices has been extraordinarily high since 2022 due to several factors, including Middle Eastern conflicts, OPEC's production policies, and Russian export restrictions.
This embedded risk premium is not a temporary distortion but rather reflects a real and lasting fragmentation of the global energy supply chain, which will likely not be resolved rapidly. So, for traders, inventory builds and softness of demand will not dictate price collapses as they may have done in a stable supply environment, because the geopolitical floor for oil prices will remain high.
The second major structural force is the energy transition. The energy transition is driving a move away from fossil fuels and into electric vehicles, solar installations, and grid storage; in turn, this shift is creating a parallel supercycle for energy transition metals.
Demand for lithium has skyrocketed due to global EV adoption, while South American producers who control the greatest share of known lithium reserves are facing ongoing political uncertainty that is periodically disrupting lithium supplies.
Additionally, copper's demand will continue to grow with increased investment in new grid infrastructure; thus, copper's long-standing role as a cyclical economic indicator is evolving into a longer-duration structural demand story.
For the professional investor, this creates an opportunity for portfolio construction: traditional energy commodities serve as both an inflation hedge and a geopolitical hedging strategy, while energy transition metals provide a longer-duration structural growth exposure.
For the beginner investor, the easiest way to gain exposure to this theme is through a commodity ETF with energy transition metals or a CFD on lithium or copper prices through a trading platform that offers these instruments.
How to Use Inventory Reports and CFDs to Trade Commodities Effectively
The statistics that are released every Wednesday morning by the Energy Information Agency (EIA) regarding crude oil inventories are among the most consistently market-moving statistics in commodity trading.
This statistic represents a measure of the change in US crude oil inventories on a week-over-week basis, and its market impact is solely dependent on the printed figure’s deviation from the consensus estimate prepared by analysts.
For example, if a surprise is reported of 4 million barrels drawing on stocks, while the consensus estimate indicates a 1 million barrel build, then volatility will be present in the price of WTI with a potential movement of 2% to 3% in a matter of minutes; whereas the opposite would occur for an actual build of 4 million barrels versus a 1 million barrel build.
Similarly, USDA crop reports serve the same purpose as EIA’s report for commodity markets, typically in agricultural commodities. The monthly World Agricultural Supply and Demand Estimates report updates the production, consumption and ending stock forecast for major crops; thus, the differences between consensus estimates and actual results drive sharp movements in corn, wheat and soybean futures markets.
Here, the particularly important criterion to apply when evaluating the merits of these types of reports is tracking not just the data, but the consensus estimate before the release of each report. This is critical to ensure that each trader is accurately interpreting the numbers against the market’s expectations.
CFD trades are particularly appropriate for all of these event-related opportunities, as they allow you to quickly establish a position with defined risk ahead of, or just after, the actual release of a statistic.
For example, if the trader is biased toward a surprise draw in the EIA report, they may elect to establish a small long CFD position in crude oil before the release of the report, with a stop-loss placed below an important technical support level to limit downside risk if the released data is bearish.
The ability of CFD trades to provide leverage means that a small percentage move in the underlying price will generate a material percentage return to the trader’s margin.
What separates successful event-driven traders from unsuccessful ones is the size of the positions taken. Because of the large inventory data surprises, large and quick price moves can occur in both directions, and the large-leveraged positions can be eliminated from an adverse release prior to a stop-loss order executing cleanly with respect to the significant price volatility associated with the report, preventing any material loss to the trader.
Professional traders successfully utilise small position sizes relative to total account equity, and treat each trade made with the intent to capitalise on a market reaction to a release of statistics as a bounded risk event rather than an event driven by conviction; this is how professional traders generate the most profit while minimising the risk of substantially depleting their accounts.
Essential Risk Management Tips for Commodity Traders
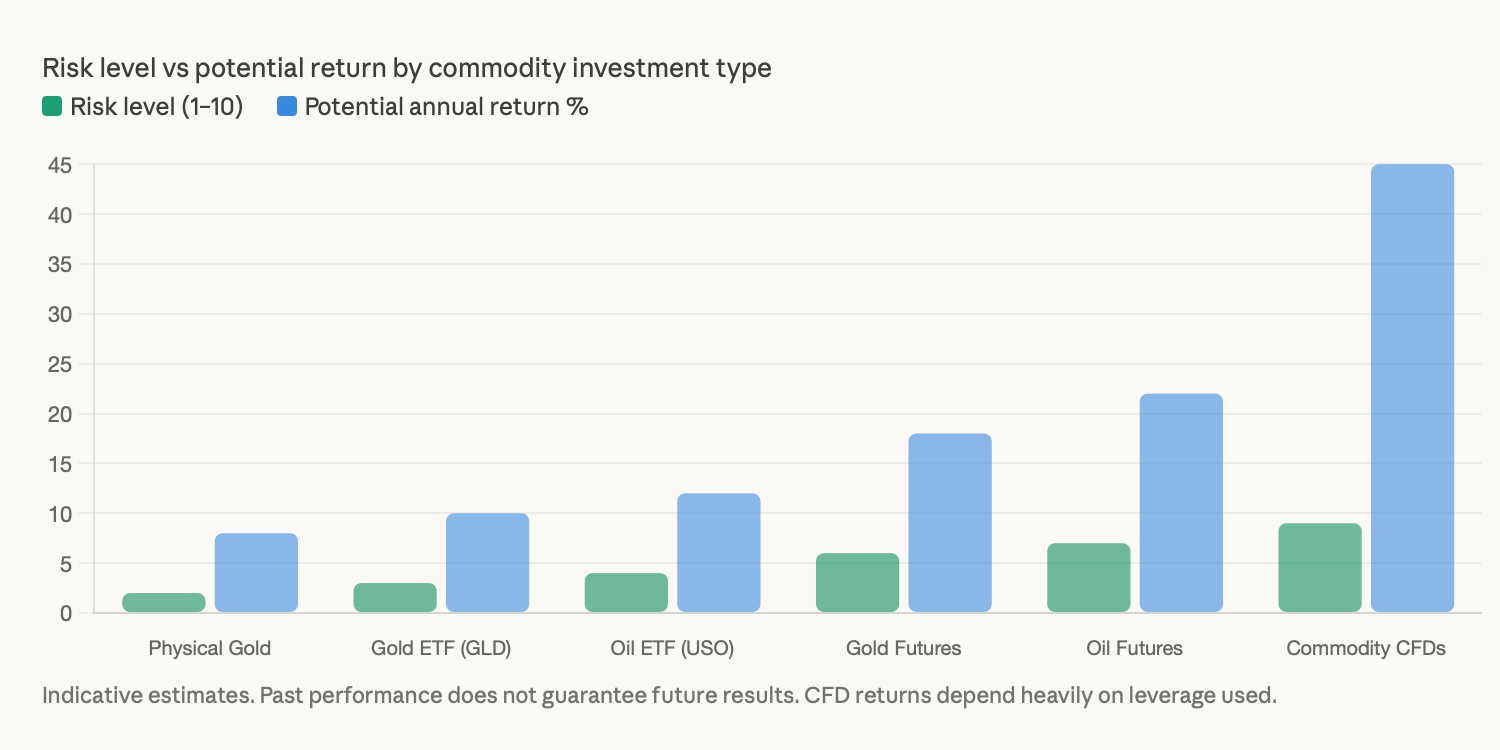
The chart of risk discussed above shows the need for traders to carefully weigh how appealing CFD leverage is against its high likelihood of causing them to suffer rapid losses at times when they may be expecting to achieve similar types of trades. Commodities markets are very volatile, and volatility does not care about position size or whether or not you have a large enough account balance.
In April 2020, WTI Crude oil futures delivered in May traded temporarily at a price of negative $37 a barrel. There were many traders who experienced massive losses on May crude since most of them did not take into consideration how physical delivery obligations and storage would work. For those traders who were long levered, they lost money that was greater than their original margin. Risk management is designed to prevent this sort of trading error.
Using stop-loss orders is one of the basic and necessary elements of any type of commodity trading approach that uses leverage. By setting stops at a technically significant level, such as below a recent support area or at a percentage loss that you would genuinely be able to tolerate losing on a trade, this becomes very helpful in removing the temptation to give a losing trade the possibility of recovering by holding on to the position longer than necessary.
Additionally, using a diversifying strategy across different commodity sectors would make it impossible to have a single event, such as an unexpected OPEC production increase, to unravel your entire book of trades instantly.
One should take into consideration the psychological aspect, just as much, or more, than the mechanical. There are continual compelling displacement narratives that appear, creating constant urgency to aggressively position oneself into the market, and at times when the risk of losing money is at its highest.
Developing the habit of asking yourself, "How will this trade turn out if the narrative turns out to be false?" before making any trade is the sort of mindset that will define traders who are able to survive the volatile cycles and those who will not.
Using smaller-sized positions in ETFs for long-term core inflation hedges and using larger-sized CFD positions for more short-term tactical strategies gives a risk configuration that can operate through both calm and turbulent market cycles.
FAQ
Is commodity trading suitable for beginners? It can be, if you start with the least complex instruments. Gold ETFs like GLD and broad commodity ETFs require no specialist knowledge of futures mechanics and can be purchased through any standard brokerage account. CFD trading involves leverage that can amplify losses, so beginners should use demo accounts to build familiarity before committing real capital.
How can I use commodities to hedge against inflation? The most straightforward approach is allocating a portion of your portfolio to gold or a broad commodity ETF. Gold has historically maintained purchasing power across inflationary periods because its supply grows slowly and its price adjusts upward in nominal terms as currency value falls. Even a 5% to 10% allocation to commodity exposure meaningfully reduces a portfolio's sensitivity to inflation.
Which is better for long-term holding, gold or oil? Gold is the stronger long-term hold for inflation protection because it has no ongoing consumption cost and its supply is genuinely constrained. Oil is better understood as a tactical or cyclical position because demand patterns shift with economic conditions, and the energy transition introduces long-term structural headwinds to fossil fuel prices over a multi-decade horizon.
How do I manage risk in CFD trading of commodities? Keep leverage conservative, use stop-losses on every position, and never risk more than 1% to 2% of your total account equity on a single trade. Position sizing and stop-loss discipline matter more than entry timing in determining long-term CFD trading outcomes.
What is the CRB Index and why does it matter? The Thomson Reuters/CoreCommodity CRB Index tracks a basket of 19 commodities across energy, metals, and agriculture. It functions as a broad temperature reading for the commodity complex and has historically correlated closely with CPI inflation, making it a useful benchmark for assessing whether your commodity portfolio is keeping pace with inflationary pressures.
Ready to act on what you've just read? BTCDANA's commodity CFD platform gives you direct exposure to gold, oil, and energy transition metals with real-time inventory data feeds, adjustable leverage, and built-in risk management tools designed for traders who take position sizing seriously.
Open a demo account on BTCDANA and test your first commodity strategy in live market conditions before committing real capital.