




Quick-View Strategy Summary: MACD + Alligator High-Probability Trend Setup
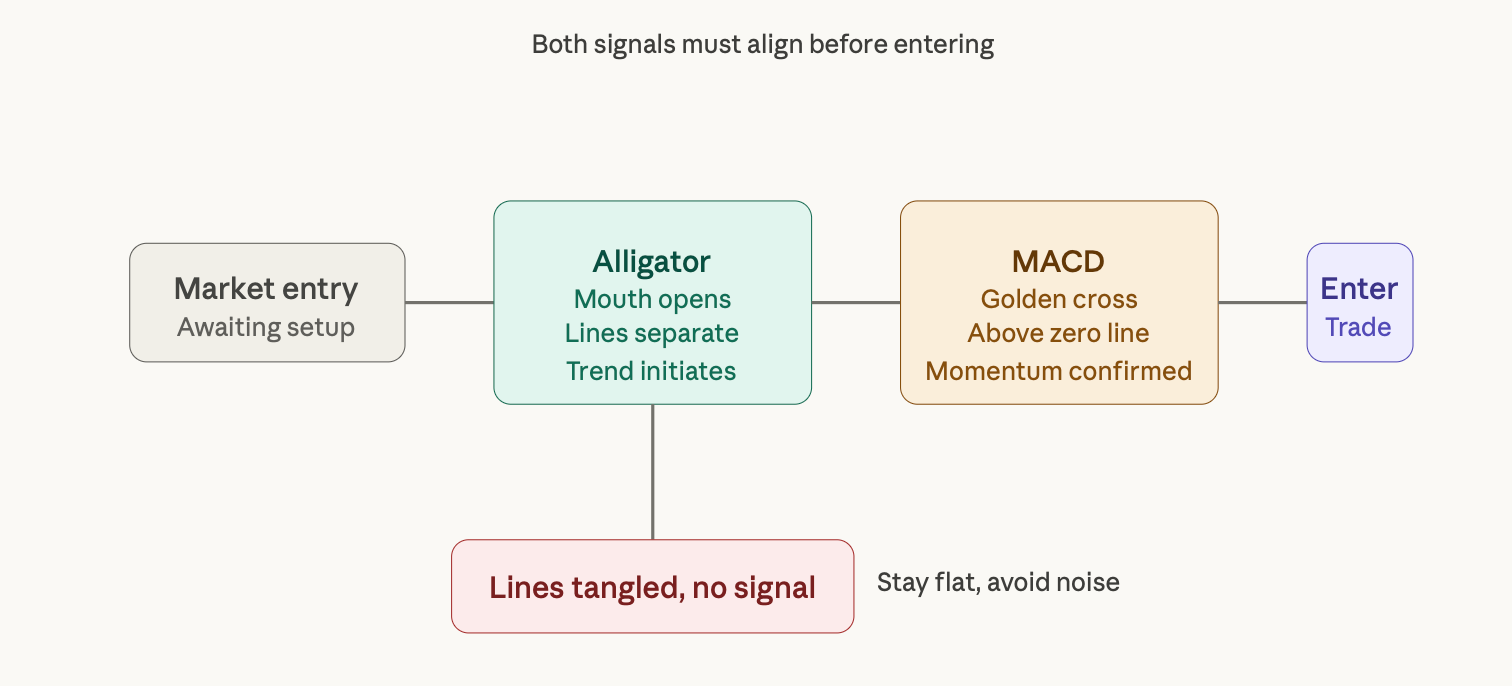
The MACD + Alligator combination is built around one core idea: the Alligator indicator identifies when a trend is beginning, and the MACD confirms whether that trend carries real momentum behind it. Together, they create a filter that keeps you out of messy, sideways markets while positioning you to capture explosive directional moves. This setup works best for swing traders targeting breakouts in assets like Gold and EUR/USD, where defined trends produce the biggest reward-to-risk opportunities.
Why MACD + Alligator Is Essential for Trend Traders
Every swing trader knows the frustration: price breaks out convincingly, you enter with confidence, and within a few candles the move collapses into a choppy, grinding range that chews through your stop. False breakouts are one of the most consistent destroyers of trading accounts, and they happen precisely because most traders rely on a single indicator that cannot distinguish between real trend momentum and random market noise.
The MACD + Alligator combination solves this by layering two complementary signals on top of each other. The Alligator tells you when the market is waking up from a period of consolidation, and the MACD tells you whether that awakening carries genuine force. If both agree, you have a high-probability setup. If they disagree, you stay flat and let the noise run its course.
This guide walks you through everything from the foundational mechanics of each indicator, to precise entry rules, momentum swing capture, disciplined risk management, backtesting results on real assets, and finally how to spot divergence signals that warn of coming reversals before they happen.
MACD + Alligator Indicators Explained: Trend and Momentum Filtering
In order to effectively implement this system you must have full confidence in your understanding of all indicators, particularly the ability to read and interpret signals offered by each of them without hesitation.
The MACD Indicator is comprised of three different parts that work together in conjunction with one another. The Fast Line (EMA12) is the shortest period moving average moving average and will typically respond quickly to price movements. Conversely, the Slow Line (EMA26) is longer term in nature and will represent a more general or broader trend.
This is further identified by using the MACD Histogram which is nothing more than the difference between the two lines above. As such, the height of the MACD Histogram bars will indicate momentum building or fading based on all three parts of the MACD indicator. The most important reference point when measuring momentum using the MACD is the "zero" line; if the MACD crosses above this line, than you have Bullish Momentum and if the MACD crosses below the zero line then you have Bearish Momentum.
Additionally, your best signal or indication of trade timing will come from the slope of the MACD Histogram, NOT just the relationship of the MACD Histogram to the zero line.
The Alligator Indicator was developed by Bill Williams and uses three smoothed moving averages that have specific offsets into the future. The Jaw (blue - 13 period SMA with 8 bar forward offset) is the longest or slowest moving average and represents the longest term trend.
The Teeth pertains to the second longest or the middle (red - 8 period SMA with 5 bar forward offset) period moving average, while Lips (green - 5 period SMA) has the shortest or fastest period of these three moving averages and typically leads to change in the Alligator's other two moving averages.
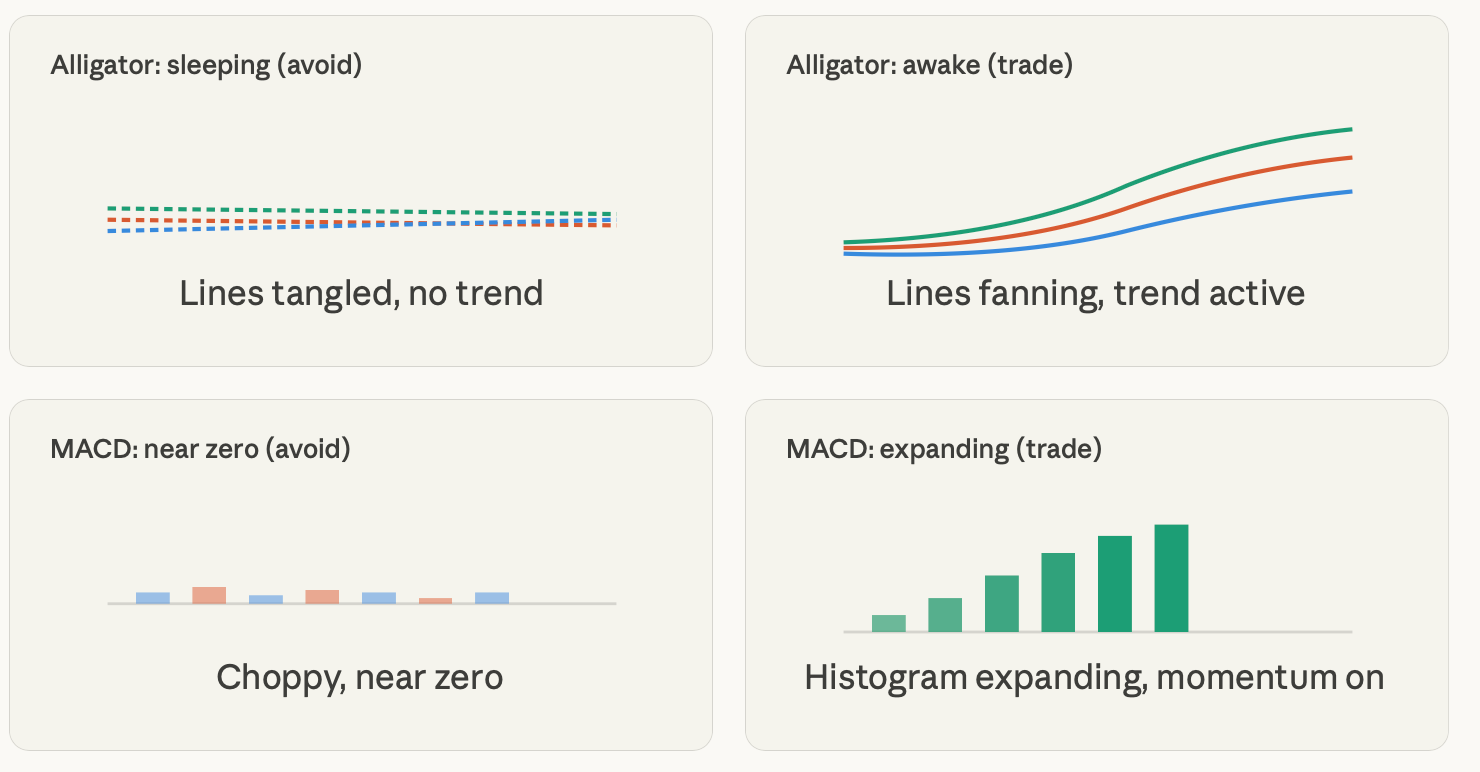
When the Alligator is "sleeping" means that the three moving averages are intertwined and flat, than Market is consolidating. When the Alligator is "waking up" means that the three moving averages have become un-tangled and are fanned out in order; i.e., the Jaw is on the bottom, then the Teeth, and finally the Lips, then a new trend is probably forming. The degree of "mouth" opening will indicate the strength of the new trend.
The combination logic exists because the MACD and Alligator are measuring different things. The Alligator looks at the structural trend and directional approach of the Market, and the MACD is providing an indication the rate of momentum or how fast something is happening in the Market.
Thus, you could have the Alligator start to fan out while at the same time have the MACD show no, or even negative momentum, which would suggest this is not a Buy Entry; rather it provides a Red Flag. Therefore, in order for your buy entry signal to be valid you must have both of these tools pointing in the same direction at the same time.
To look at it this way: the Alligator is the racetrack to determine the direction of the race and the MACD is an engine reading, which is what you use to determine whether or not your car is capable of winning the race. Therefore, you would not enter a race, where the race track is flat and your engine is sputtering, nor would you floor the accelerator when you cannot see the starting line.
One example of the above would be from the Gold H4 chart. When the three Alligator lines are intertwined and the MACD histogram is oscillating relatively close to the zero line, this represents a consolidation phase, and you should remain on the sidelines. When the three Alligator lines begin to separate from each other and the MACD histogram begins to extend higher on one side of the zero line, this represents the combination indicator is "turned-on".
High-Probability Entry Setup: Avoiding False Breakouts with MACD + Alligator
The biggest mistake a lot of traders make are entering into positions too soon. This happens because; when they see the Alligator Lines begin to separate, they get excited and jump in prior to the MACD confirming momentum.
The Alligator, when in a sideways market, will sometimes open its mouth a little bit, create to the perception of a valid breakout but, just as quickly, close back up again as soon as the price returns back to the range again.
This is commonly known as the false breakout trap, and is very common in times of low liquidity such as the Asian session for FX pairs.
To help prevent premature positions the entry rules of this trading strategy, require confirmation from both indicators before opening the position.
The two primary entry conditions for a long position require the Alligator mouth is clearly opening up, and that the MACD line is crossing above the Signal Line, with the histogram above zero, or crossing from below zero with expanding heights of bars.
To meet the conditions of a short position you would reverse the conditions above in order to generate a signal. You would have the Alligator fanning down, and the MACD line would cross below the Signal line with the histogram in negative territory and expanding.
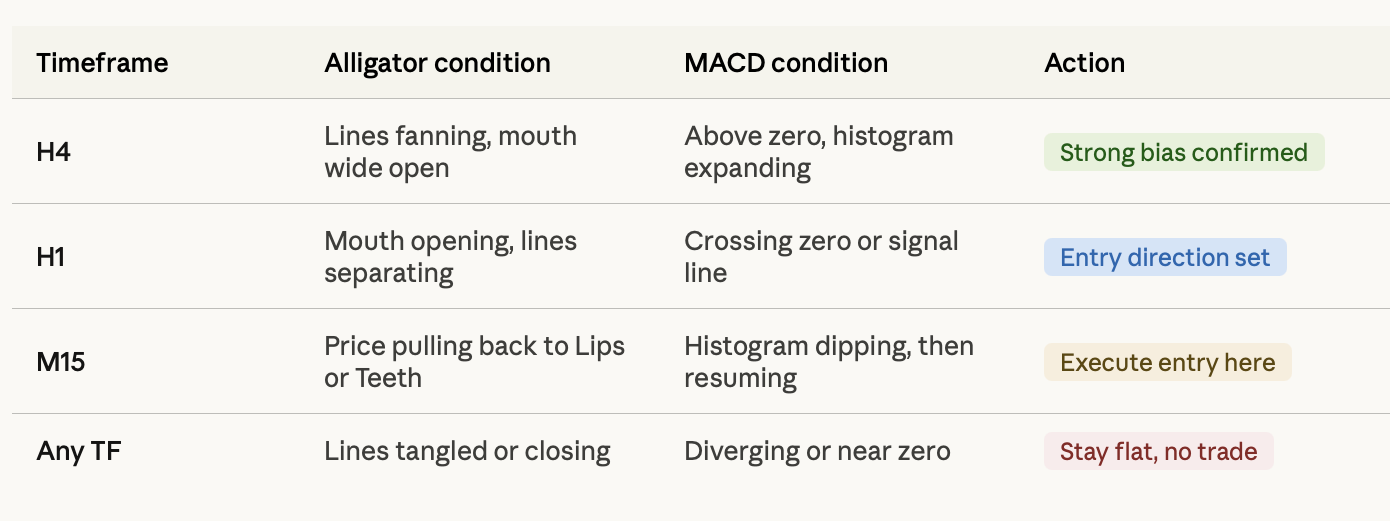
A third condition that greatly increases the accuracy of your trades is confirming the direction of the overall trend by using multiple time frames. First establish the overall direction of the trend on the H1 chart by looking at the Alligator and MACD positions.
Once you establish the direction you can then change to the M15 chart to fine-tune your entry points with the candle patterns. This helps you to remain in the direction of the overall market structure but allows you to enter the market at a technically accurate point instead of waiting to chase price after there has already been a price movement.
Your position sizing for the first signal of any new trends should be kept to conservative position sizes, roughly 50% of your normal position size. After the first 1–2 trends are confirmed and each trend respects the Alligator's lines as dynamic support/resistance then you can properly size your position accordingly.
Capturing the Power Wave: MACD + Alligator Momentum Swing Strategy
The majority of profits from trend trading aren't earned by favoured trades commissions, but rather from being able to identify one large violent period when the market has made an absolute commitment to move one way and is moving quickly. This is referred to by traders as a 'power wave', or 'momentum swing' period, and it will provide the highest ratios of risk versus reward you should anticipate from this trading style.
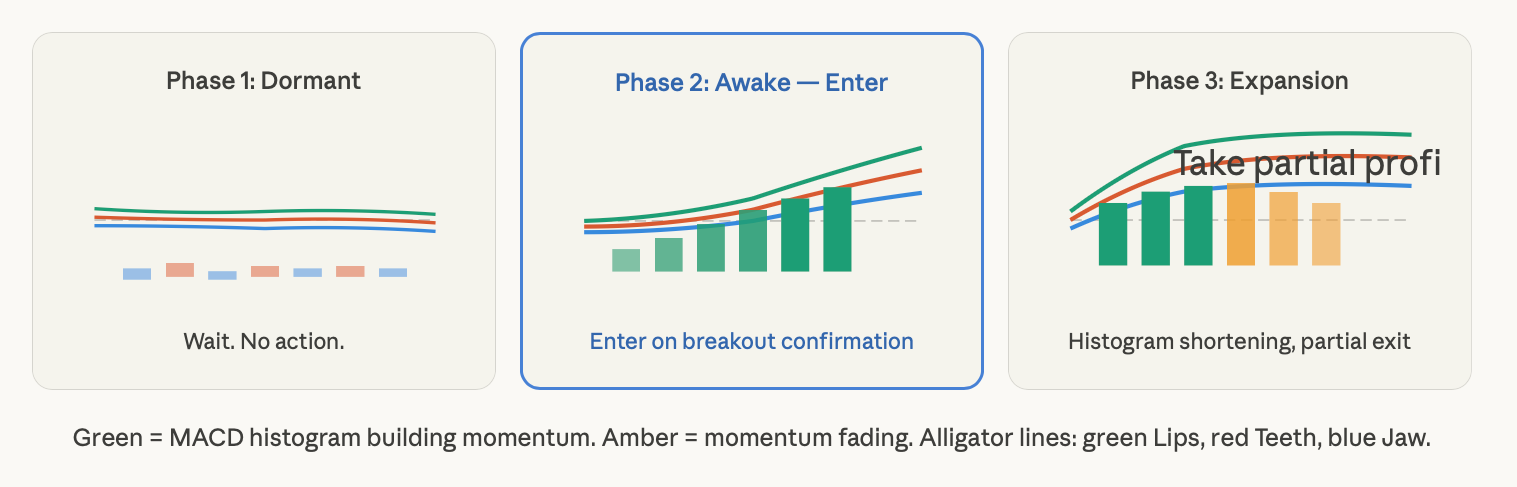
While you're watching the market to see how it will behave during the slow period prior to a trade set-up, you will need to have patience just like an alligator. When all three lines of the Alligator are intertwined and the MACD histogram oscillates around zero, you're witnessing a market compressing energy for an upcoming breakout. Your job during the 'compression time' is just to observe, not trade.
When the Alligator opens its mouth across 2 to 3 consecutive candlesticks in the same direction, this is the most obvious indication that confirmation has come that a momentum expansion is about to take place and, therefore, this is when you would establish your initial trade position.
While in the power wave you would not chase the trade by trailing your stop aggressively from below. You should allow the stops being trailed to adjust for the natural volatility associated with the trend and to allow the Three Lines of the Alligator to act as a trailing stop. You are allowing yourself the best opportunity to stay in the trade until the end of the trend by not exerting aggressive effort in allowing yourself to be shaken out through a number of pullbacks.
You can start to lock in partial profits once the MACD histogram begins to produce divergence, which is when the MACD histogram begins to produce shorter bars after a series of longer ones.
This indicates that the momentum is beginning to tire, even if the Alligator hasn't yet indicated that it would be closing. Locking in between 30% - 50% of your trade at this point will secure some profits, while you can still leave some exposure for the final leg of the trend.
MACD + Alligator Risk Management: How to Avoid Being Harvested in Consolidation
The only consistent way to lose money using this strategy is by trading it in a sideways market. This is exactly why the Alligator was invented to assist you in determining when the market is ranging.
The issue with this is that most traders either choose to disregard the alligator warning altogether or misinterpret a brief mouth-opening as an indication of a legitimate trend. Using the MACD to confirm or deny trades significantly helps with this issue when applied appropriately; however, it takes discipline to await full confirmation.
When the Alligator lines begin separating but the MACD histogram is diminishing or has shorter bars than those preceding them on the same side of the zero line, a warning has been sent concerning the direction of price and momentum are not backing up each other.
This type of setup often results in rapid reversals that result in early stop loss placements within a few candles after a signal has been sent. When using this strategy, the stop needs to always be placed beyond a structural level of obvious significance. For long trades, you will find the most recent swing low or the Jaw line (blue); which is the slowest and most obvious MA to use for establishing where to place your stop.
For short trades, the stop will be placed above the most recent swing high or above the Jaw line. Stops placed just behind the Lips (green line) are going to be too close, which will lead you to be stopped out due to the natural volatility of the trend prior to the resumption.
Risk per trade should be limited to a maximum of 1% to 2%, of trading capital. When placing trades with a new signal/trend not yet established or awaited, limiting the risk of the trade to the lower 50% of that percentage protects you from the event that the market provides you a false signal, although both MACD and Alligator line up correctly. The market does not function on determinism; therefore, even when you are exposed to the finest setups as a trader, they will fail a certain percentage of the time.
MACD + Alligator Backtesting: Gold and Crude Oil Case Studies
In order to judge a trading strategy, it is important to see how the numbers look like over a large number of trades.
Therefore, when applying this strategy to the H4 and H1 Time Frame for Gold (XAU/USD) and Oil during the 2023-2026 period, it becomes evident that, in general, those trades where the market is trending strongly and has enough average true range to create significant movement after an entry confirmation tend to yield the most favourable results when employing this trading system.
As above, when employing MACD parameters of 12 / 26 / 9 and Alligator settings of 13 / 8, 8 / 5, and 5 / 3; in general the following statistics were observed for each asset and Time Frame.
For example, Gold (H4) where a trend usually exists for several days at least, had a higher proportion of wins and better ratio of risk to reward than did Crude Oil (H1) which had a larger number of signals being generated, but a larger number of news based reversals, resulting in more losses relative to Wins. EUR/USD (H1) experienced a middle ground between the two in both frequency of trades and degree of accuracy.
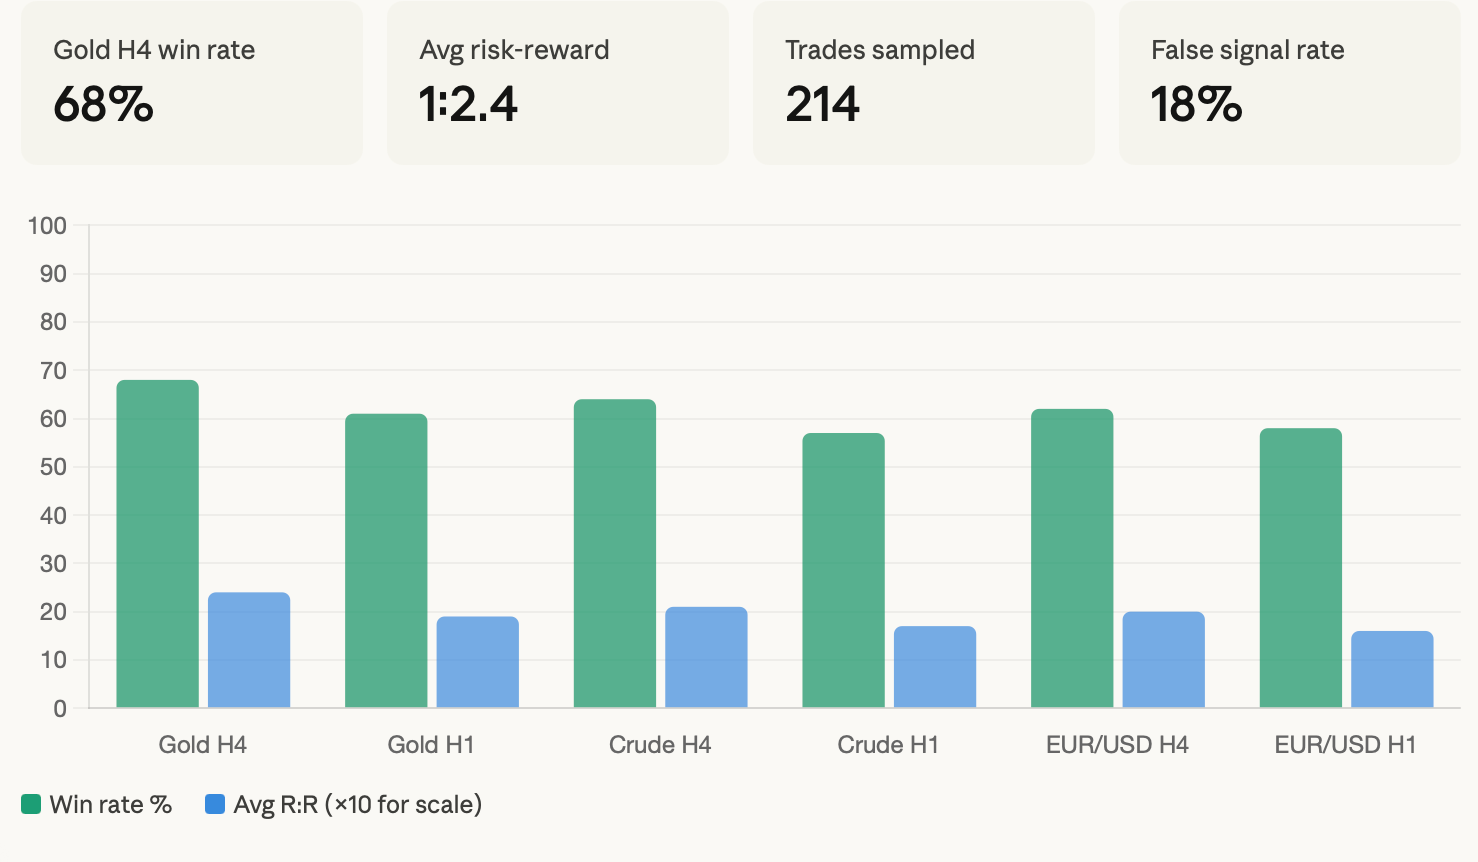
This strategy has consistently demonstrated success at higher timeframes than at lower timeframes. Longer timeframes help filter out the intraday noise that produces false signals on lower timeframes, while also allowing room for trends to build to the power wave stage for some of the largest profits available.
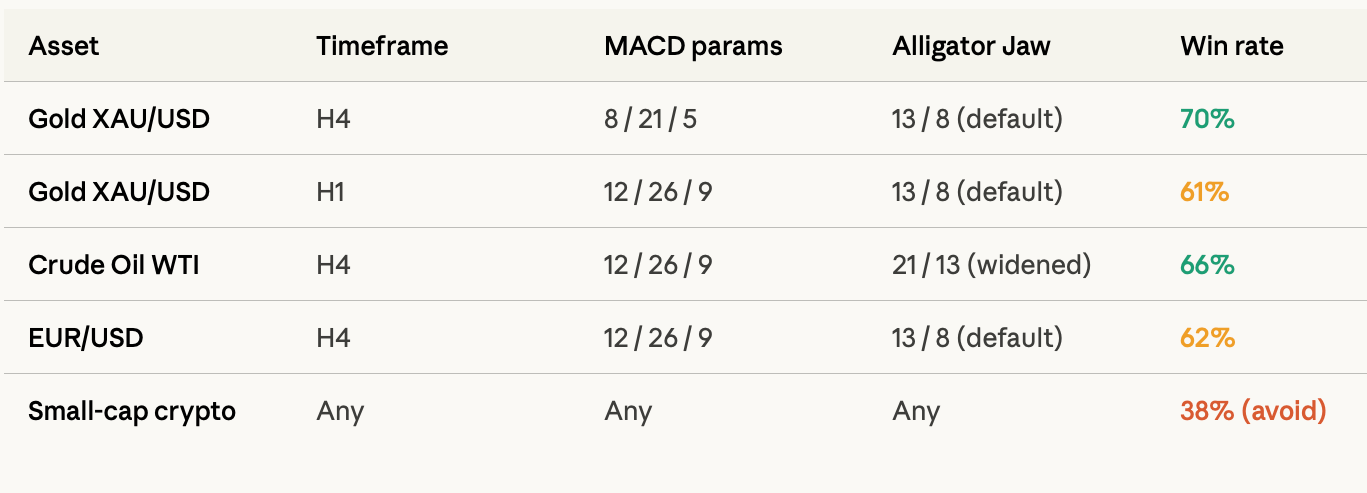
Testing of small-cap crypto and illiquid assets showed an emphasis on these types of assets as producing fewer profit opportunities due to a lower amount of liquidity and more frequent false signals. Therefore, it is very important only to use this strategy in liquid, trend-following markets.
Parameter adjustments may enhance performance for individual asset classes. One example of this is found in a trader's use of Gold. When solely using Gold as his trading vehicle, he found greater responsiveness from the MACD signal linewhen than when using more common 12/26/9 settings.
Another example would be found with traders who traded crude oil: During volatile supply-shocked periods, he found, by using a 21-period Alligator Jaw, he was able to reduce noise and improve performance.
Predicting Trend Reversals: MACD Divergence + Alligator Closing Signals
The skill that is most important for a trend trader is the ability to tell when a trend is about to conclude, long before price action provides any confirmation through a rapid movement in the opposite direction. MACD + Alligator offer two leading signals that indicate that a trend will soon lose its energy; when these two signals converge, they provide one of the best indicators available that a trend is losing its strength.
An example of MACD divergence is when the price of a security continues to move upward, making a higher high inside an uptrend, while the MACD histogram does not make a corresponding higher bar. In this situation, price continues to climb, however, the momentum driving the move is declining in size. Therefore, there are fewer and fewer buyers of the security's price advancing and therefore the structure of the trend is "weakening."
For an instance of Alligator closing signal, after the three lines have fanned widely apart while in a trend, they converge back towards each other. The Lips (green) are usually the first to turn inwards towards the Teeth (red); and when both are converging towards the Jaw (blue) the Alligator is going to sleep again.
Thus, the trend phase will soon transition back into either consolidation or eventually reverse.
Together, MACD divergence and Alligator convergence, provide the strongest signal possible that the trend is about to exhaust itself. Reasonable responses at that time would be closing any remaining positions, tightening any stops, or looking for short-term opposing entries.
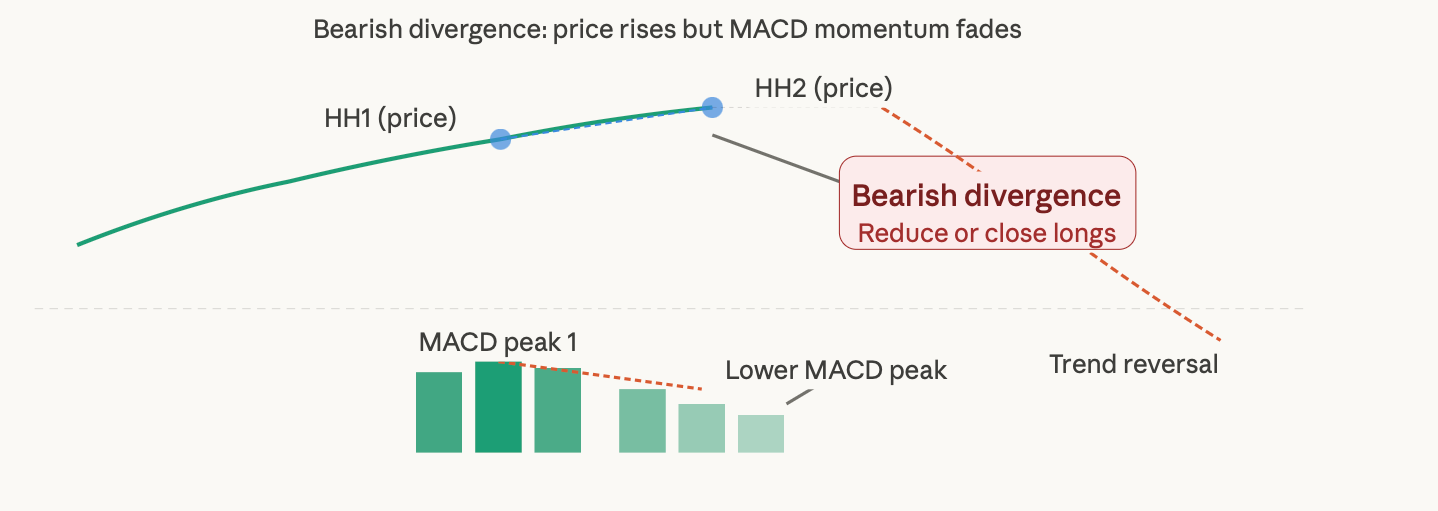
Specify what the divergence signals mean for you. They don't assure an immediate reversal. In a strongly trending market, divergence can show up, and still create new extremes for multiple sessions and then show a reversal. Use these signals as early warnings of needing to tighten risk management, not as automatic flip positions. Use with the Alligator closing signal and with a valid candle structure like a bearish engulfing pattern and failed breakout to a key resistance level before entering any reversal trade.
Extend Your Knowledge: Related Strategies and Further Reading
If you've begun to enhance your trend-following strategies, there are a number of adjacent areas that lot of different options to allow some compounding on top of your existing edge.
One of those ways to build that edge is through an understanding of how to position for trend continuation in CFD markets when using asymmetric risk instruments have, by having multi-level tactical flexibility once you've been able to identify if you have a solid directional move.
Working with trend-following strategies and their interaction with volatility-based methods to measure the risk associated with each trade will allow traders to size their positions intelligently under a variety of market conditions versus applying one standard-sized position on every trade.
Lastly, using a long call options approach will provide traders with a structurally different method to participate in the explosive trend phases identified through this strategy while minimizing their downside exposure during the highly risky entry period associated with false signal risk.
Ready to put this strategy to work on real markets? At BtcDana.com, you'll find live analysis on Gold, crude oil, and major FX pairs using exactly this approach, updated as markets move, so you can study real setups rather than textbook examples.