


While determining if the company is a suitable investment, you may have one number that sums up what you'd like to know about its financial stability: Interest Coverage Ratio (ICR). This number expresses how easily a business can pay the interest on its existing debt; if you wonder if a company will meet its obligations to pay its debts or even if it is financially sound enough to withstand business downturns, understanding the ICR is important.
What does ICR ratio mean? Learn about Interest Coverage Ratio
ICR is simple. It is how many times over a company can meet its interest expense from its operating earnings. The formula looks like:
ICR = EBIT / Interest Expense
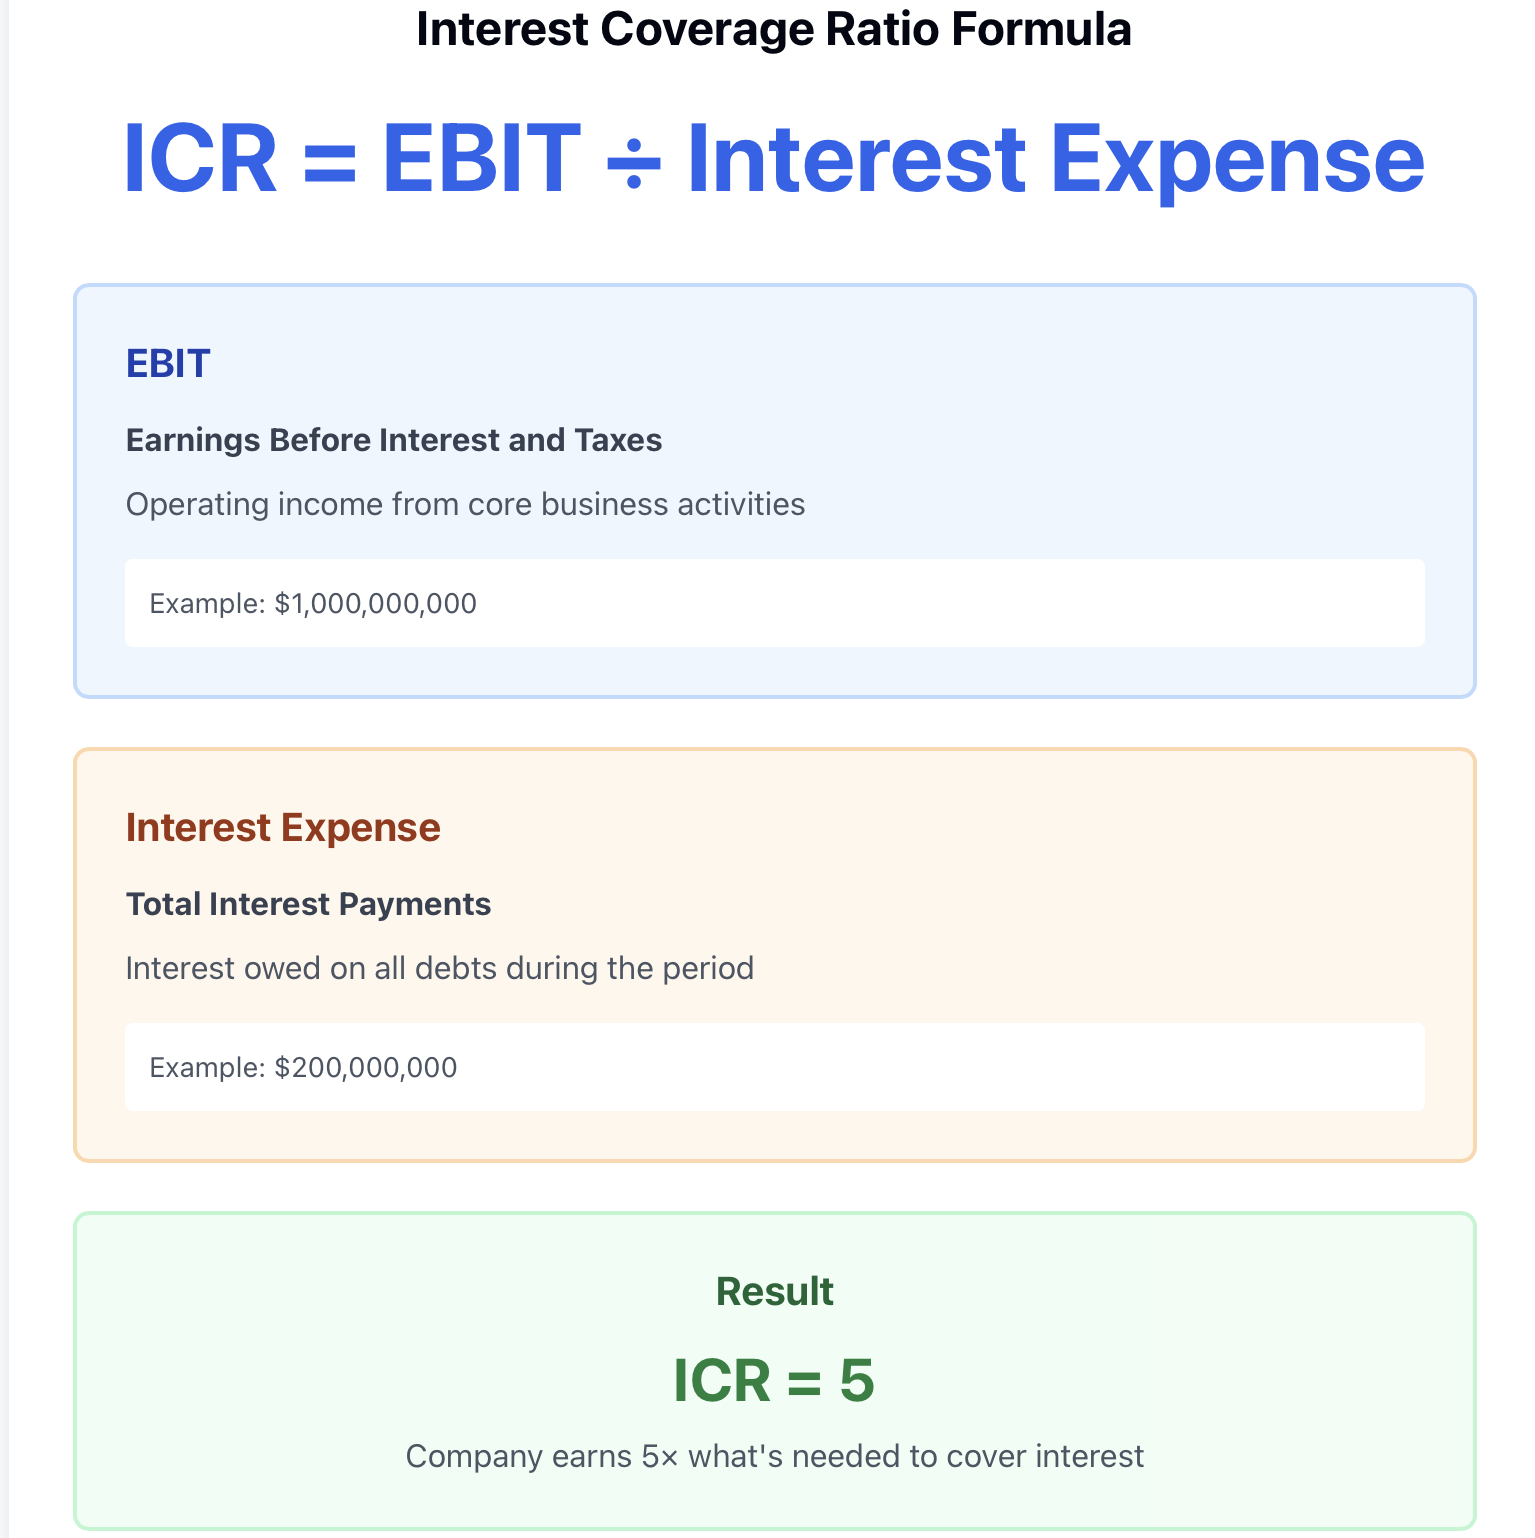
EBIT means earnings before interest and taxes. It is what a company has earned on its core operations without being factored in interest payments and taxes and interest expense is the total interest a company has owing on all debts during a period.
Think of it this way; if you earn $5,000 a month, and your mortgage interest is $1,000, you are keeping your ICR at 5. That means you are earning five times what you need to cover that interest payment. This is how this number works for companies too.
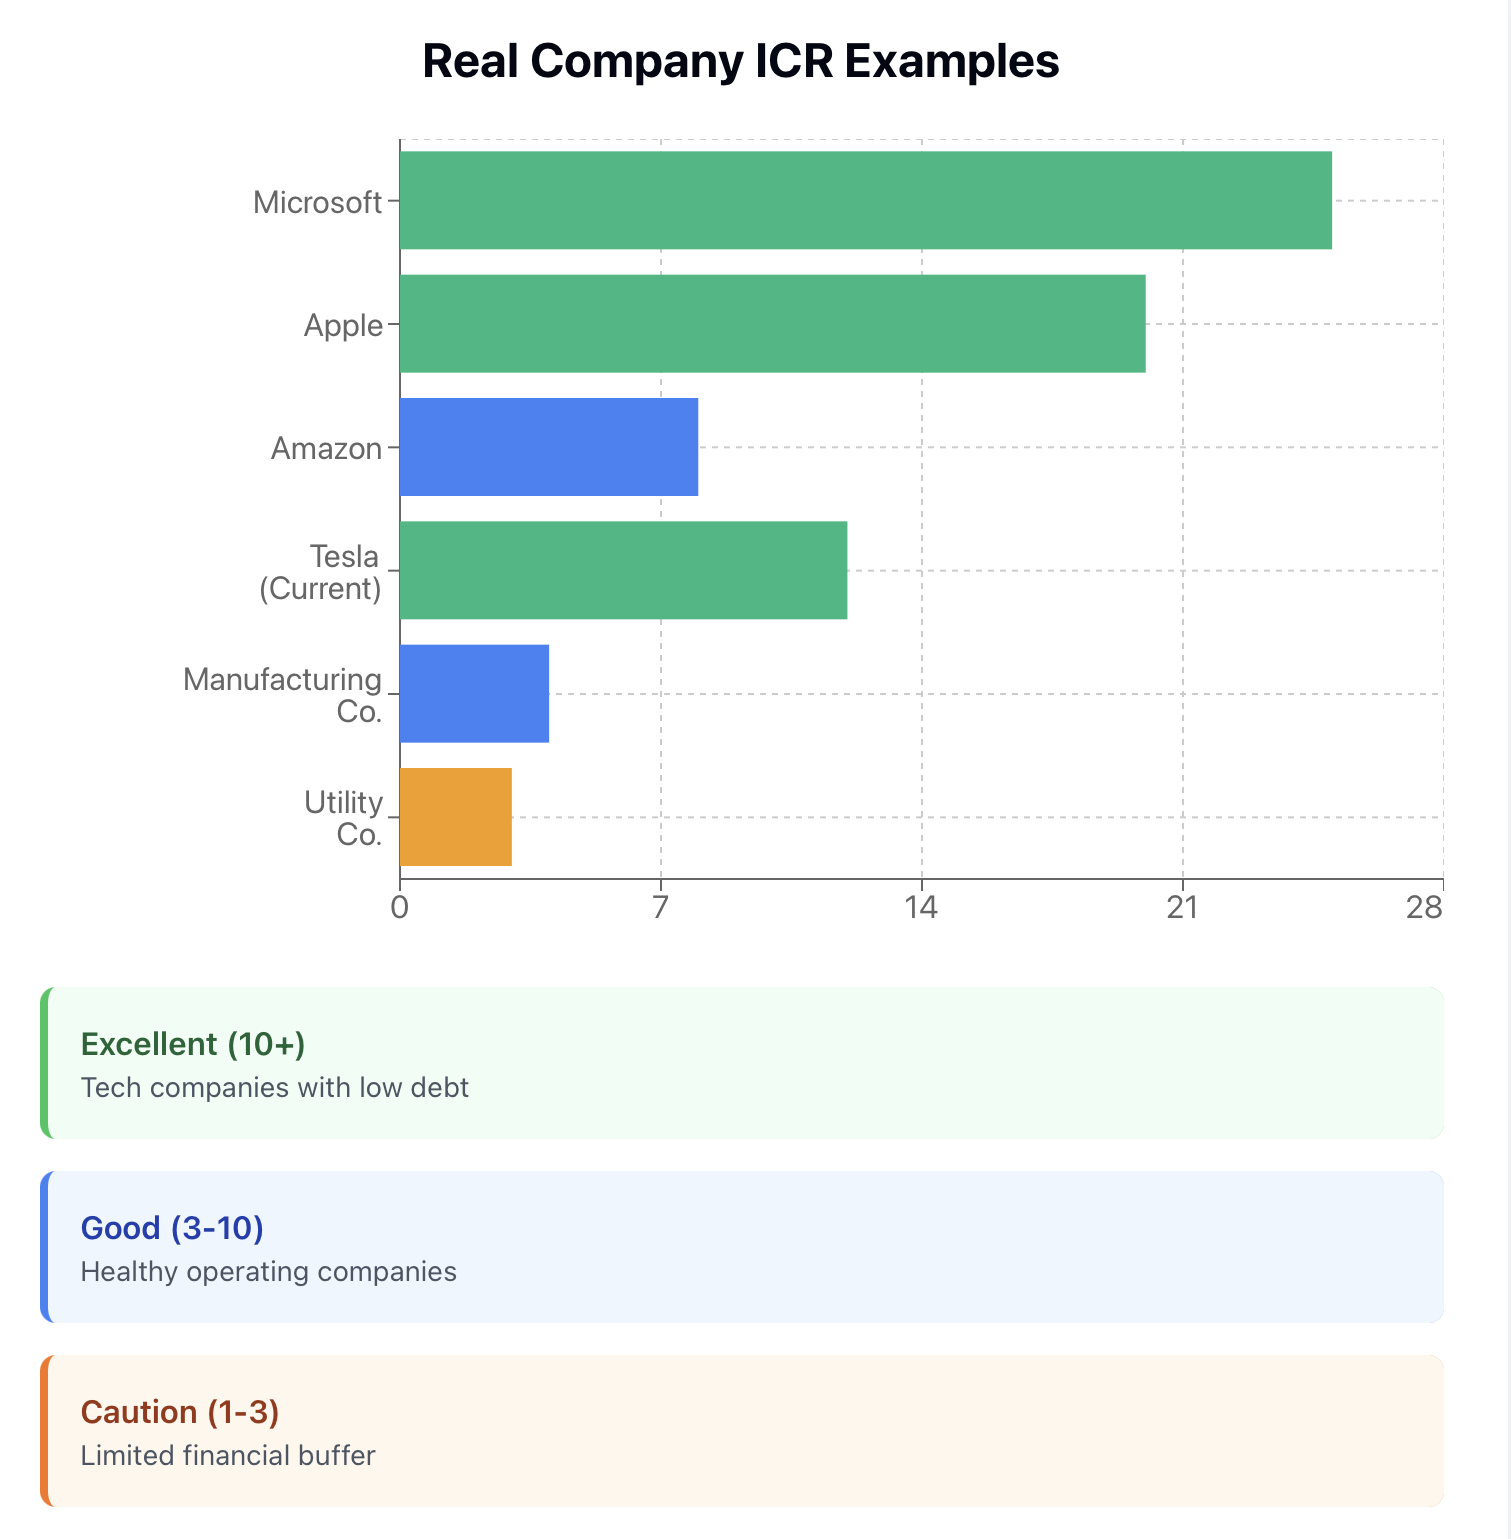
On the example of Apple Inc reporting an ICR of 20, it means the company's operating earnings are 20 times that. Apple has a comfortable margin.Amazon's ICR has varied in recent years because the company has taken on debt to support expansion, but looking at these shifts informs investors of the company maintaining the capacity to service that debt.
The beauty of ICR is that it is simple; you don't need to be a financial expert to understand what it conveys. If a company is generating far more in operating income than it is obligated to pay in interest, it demonstrates a strong position. If a company's earnings are barely returned to meeting their responsibilities of making interest payments, there is an indicator of looming trouble ahead.
Why The ICR Ratio Matters to Consumers
The ICR affects how lenders and credit rating agencies perceive a company. Strong income coverage ratios lend to better degrees of credit rating, therefore, a company may incur borrowings at favorable lower interest rates. Favorable leverage allows companies to save money and ideally, greater flexibility financially.
For investors, we may use the ICR ratio as a red flag indicator. A declining ICR means that the company is earning less money or incurring debt at an incrementally greater pace, or both, thus carrying a greater risk category. If you are examining the purchase of a corporate bond, it is helpful to view the issuer's ICR as it helps you assess the prospects of timely interest payments.
So think about it - if you were lending money to two friends. One friend made $10,000 per month and paid $500 per month for their debt payments. The other friend only made $3,000 per month and paid $2,500 per month. Whom would you trust to pay you back? This question is easily answered by the company's income coverage ratio.
Those that pay no attention to the ICR ratio will sometimes find themselves "surprised" or "blindsided" by a company's unmistakable financial distress. The warning signs were all there in the numbers, but they did not pay attention to it by quantifiable means. Credit analysts and bond traders think more about ICR's than they do anything else. ICR is one of the most clear indicators (underlying basis) of whether the company is able to maintain a debt load.
How to Calculate the ICR Ratio
Calculating the ICR takes two pieces of information from the company's financial statements:
Step 1: Locate the EBIT. It should already be noted in the income statement and reference either operating income or operating profit. Some companies even explicitly state this. If EBIT is not figuratively listed, we could obtain 'earnings before interest payments and taxes' by taking 'revenue' and subtracting cost of goods sold (COGS) and operating expenses. For simplicity, we have not expensed interest and tax obligations yet.
Step 2: From the income statement, obtain the recognised interest expense. Just like EBIT, interest expense should reference a separate line item that reports how much the company pays in interest during the reporting period.
Step 3: Divide EBIT by the interest expense.
Now let's consider that a company reports that it recognises $1 billion EBIT and $200 million in interest expense for the calendar/financial year ie:
ICR = $1,000,000,000/ $200,000,000 = 5.
For example the ICR = "5". Therefore, this company generates 5 times what is needed to cover normal interest payments.
The difficult part is not the calculation, but ensuring that we are calculating using the correct information. EBIT should reflect actual operating performance and if there are "one-time" or "non-recurring" gains or backwards accounting adjustment it should likely not count. Likewise, ICR does not limit interest expense to only bank loans, just as it should not be limited for consideration to 'debt' instruments (bonds, etc).
Interpreting ICR Ratio: What the Numbers Really Mean
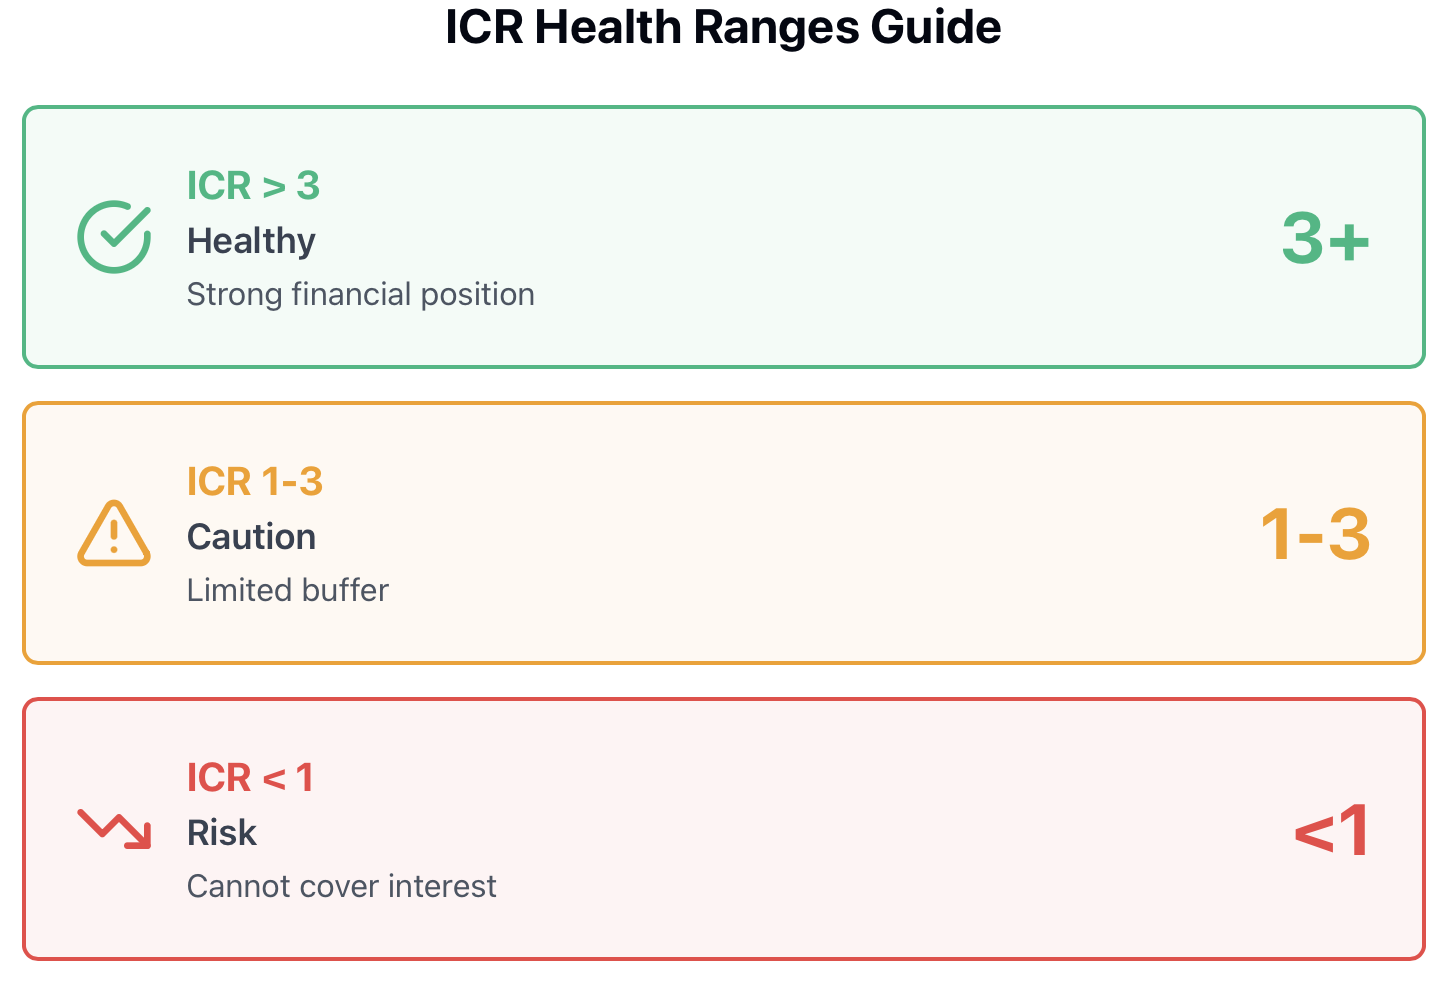
ICR (Interest Coverage Ratio) ratings serve as rough categorizations that denote different degrees of financial strength:
ICR > 3: The company is financially sound. It generates good earnings and can adequately service interest payments while having a comfortable buffer. Most analysts consider this as the minimum acceptable level of coverage in a healthy business.
ICR between 1.0 – 3: The caution range. The company is able to service interest. However, it does not have much buffer. If the company’s earnings experience a downturn or if interest rates rise, the company may have difficulty. Investors should further investigate the reason why the ICR is at this level.
ICR < 1: Red flag alert. The company is not generating enough income to cover interest expense from operating income. The company may be using cash flow, selling off non-core assets, or borrowing more to service loan amounts. This is not a sustainable condition.
As analysts assess whether a company has the ability to safely take on additional debt, they will look at the ICR ratio. A company with an ICR of 8 has plenty of room to take on debt to grow the company. A company with an ICR of 1.5 should not be taking on any additional debt.
In your own finances, if you only have enough income to cover interest on loan amounts, taking on another loan would not be prudent. The same can be said for businesses as well.
Uses of the ICR Ratio within Financial Markets
ICR can be found all across financial analysis. Bond investors will use an investor relations report to screen creditworthy corporate issuers. Stock analysts will incorporate the ICR in their stock reports to assess financial risk.
Lastly, banks will check ICR when considering whether to extend credit toWhen forming a corporate bond portfolio you may want to take on factors that assess issuers on an ICR less than 4 in order to lower the likelihood of a default. When analyzing stocks you can compare ICR scores across companies in the same sector to assess the company’s relative financial strength. ICR is relevant to traders of contracts for difference (CFD) or other leveraged products due to the increased volatility of more levered companies. An example of the potential outcomes will be evident when a company misses earning and their interest coverage is also tight.
One is able to use the ICR and other measures when building an investment. An investor may examine the ICR along with a debt to equity ratio for understanding how much debt it has in view of the shareholder equity committed to the business. Then using the current ratio for examining liquidity on a short term basis is advisable. When these ratios are looked at together, the ratios used provide an indication whether the company is over-levered or not and in default risk for their debt obligations.
Even in cryptocurrency markets, which may regard traditional financial metrics lesser than in traditional finance related markets, can have some crypto related firms beginning to publish financial statements. Even in this market you can look for ICR to determine any financially stable basis for continuing in a down-market.
Limitations and Risks of the ICR ratio. The ICR is not a flawless metric and measures only the ability to repay interest on the amount of debt, but inability to repay the principal balance on the borrowed/debt. It is possible to have a perfectly acceptable ICR but run into trouble once that firm's debt payment comes due and the company does not have sufficient cash flow from other operating activities.
As was mentioned before, EBIT can also be manipulated through accounting judgement.Firms may engage in aggressive revenue recognition or expense deferral to increase their EBIT for a limited duration. This embellishes ICR’s performance. Always ensure you read footnotes in financial statements to develop an assessment of the numbers.
Different industries come with different debt levels, which means there is a difference of what is considered a healthy ICR. Utility companies may have high debt burdens, but they maintain stable, predictable cash flow. As a result, their ICR may be lower in comparison to a tech company that experiences more volatility in cash flow, but that does not mean they are riskier to invest in. You cannot compare ICR across industries without proper context.
Capital/resource-intensive industries, such as manufacturing and energy, will always have lower ICR simply because of capital needed to fund operations. A manufacturing company with an ICR of 3 may be just fine, while a software company with an ICR of 3 may not be fine.
ICR Ratio of Real World Companies
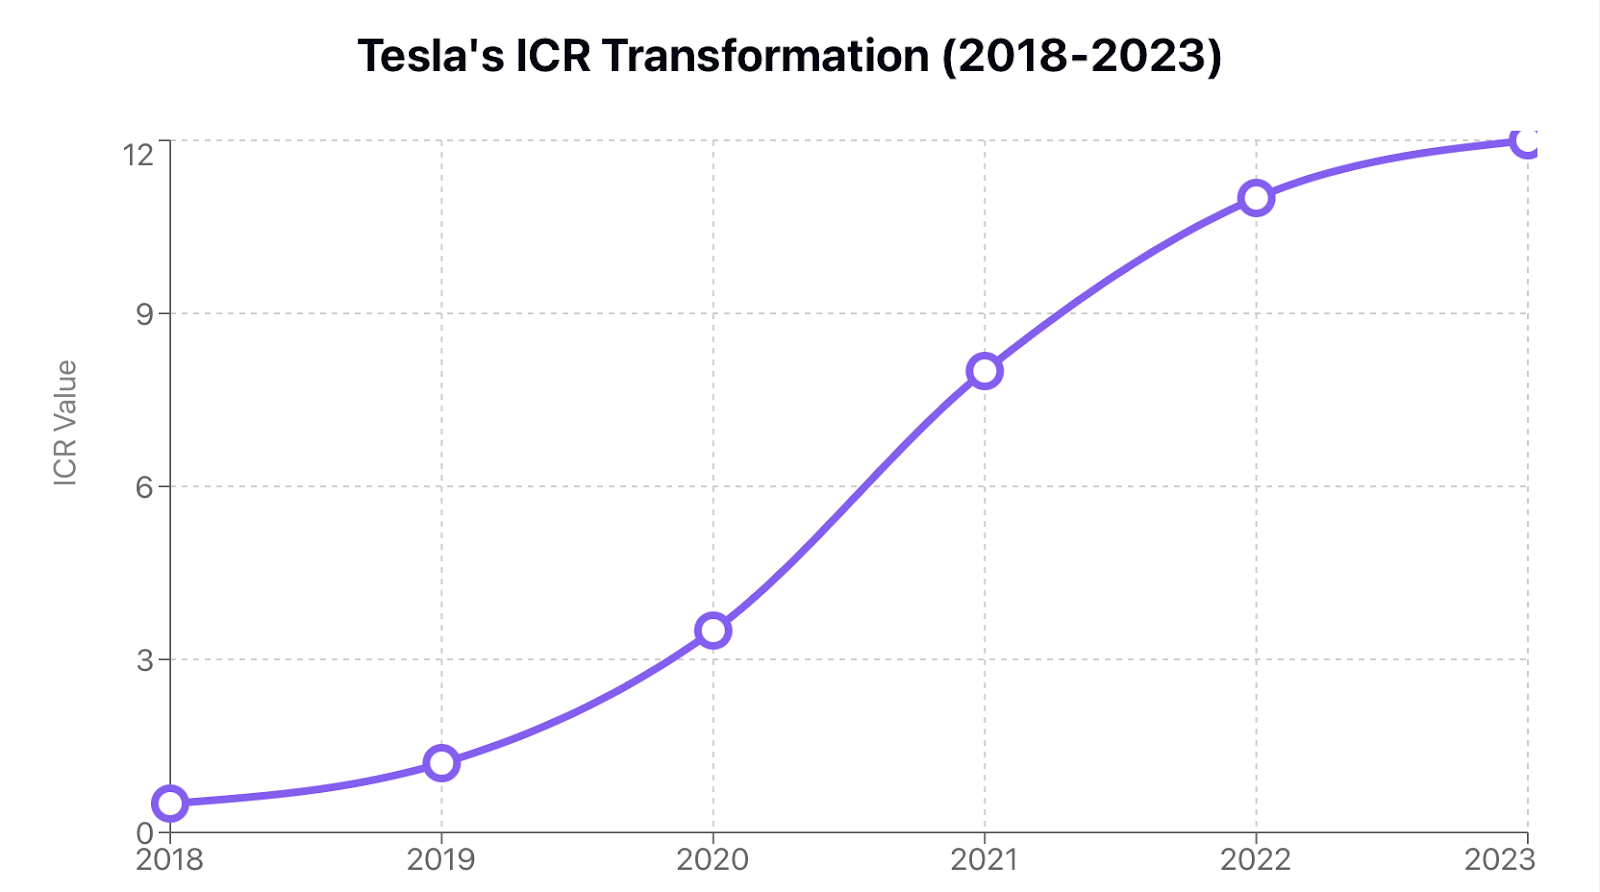
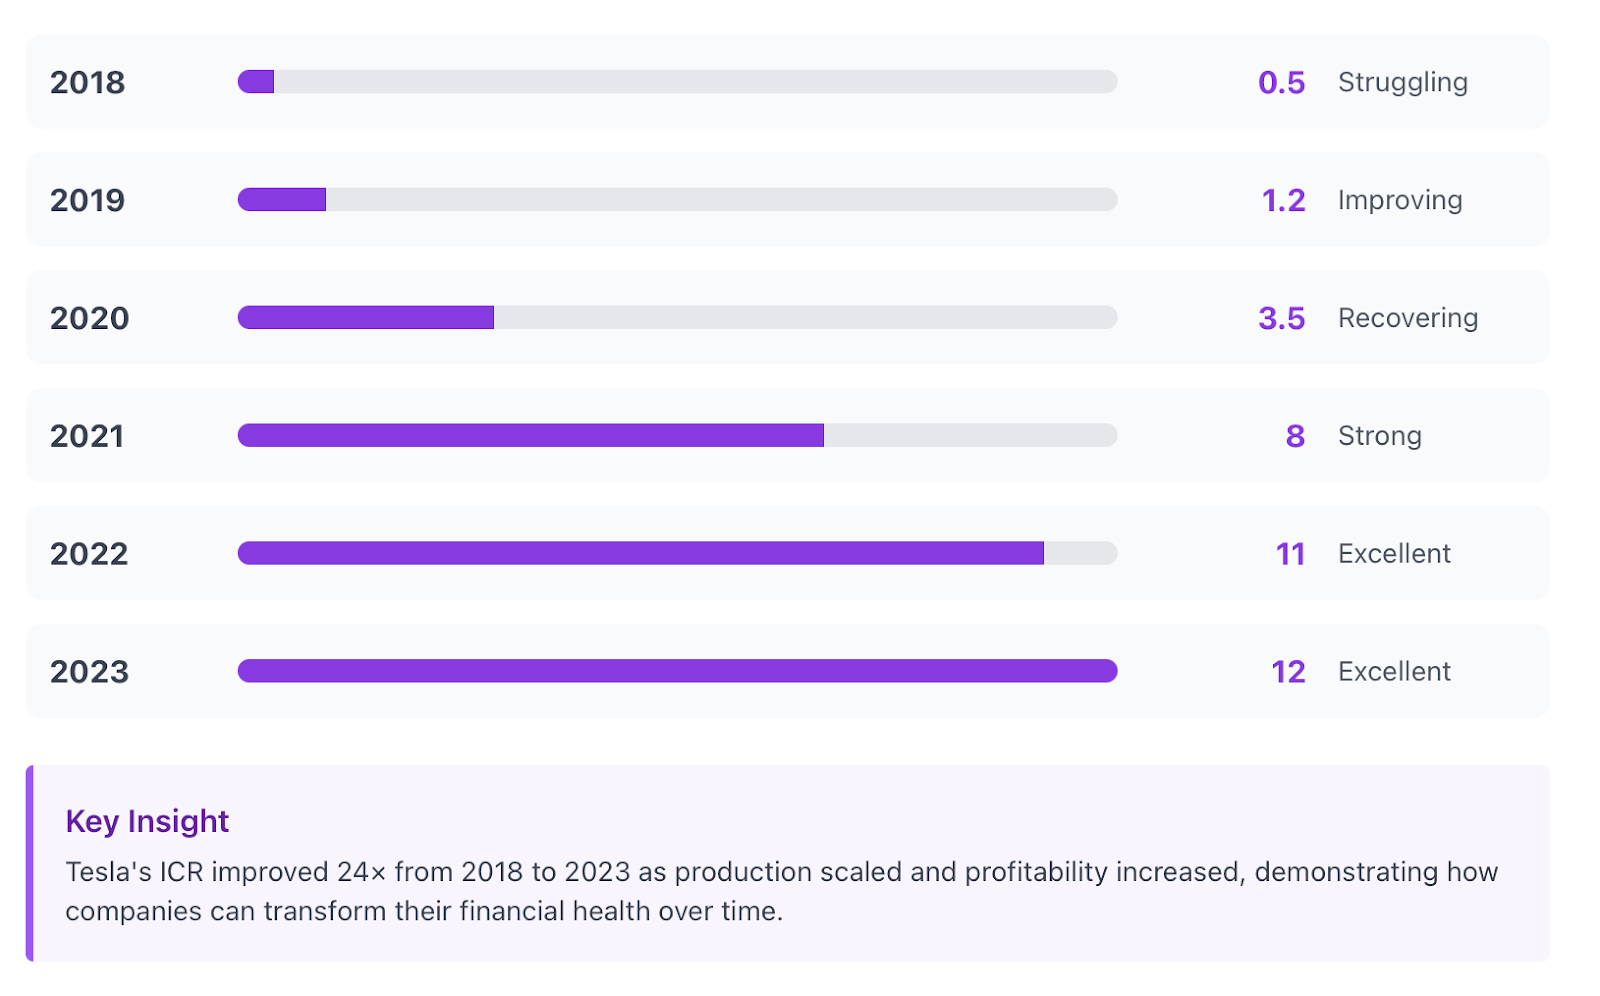
When you analyze actual companies, it makes ICR more real. For example, ICR at Tesla has improved substantially as the company has ramped up production and become more profitable. In years previous when Tesla was burning cash and had a considerable debt burden, the ICR was untenable. As operating income improved, the ratio improved as well, which means less financial risk.
At Amazon, the ICR may fluctuate depending on the investment cycle. For example, if Amazon is borrowing to build new fulfillment centers or invest in new business lines, interest expense will increase and result in a lower ICR. If you watch this ratio over time, you may be able to see if either of these investments were wisely made, in terms of the return on earnings.
Microsoft has an extremely high ICR because it continues to generate an enormous amount of operating income compared to how many liabilities it has outstanding. Microsoft could take on as much debt as they want, because they certainly have the cash flows to facilitate continued operations, but they have no need to. This financial strength gives them a unique flexibility during economic downturns.
These examples show that ICR should not be thought of as stagnant. The measurement will change as companies grow, take on debt, or improve overall profitability. It is easier and more accurate to watch trends over time rather than single period numbers.
Historical Trends of ICR and Effect on Stock Price
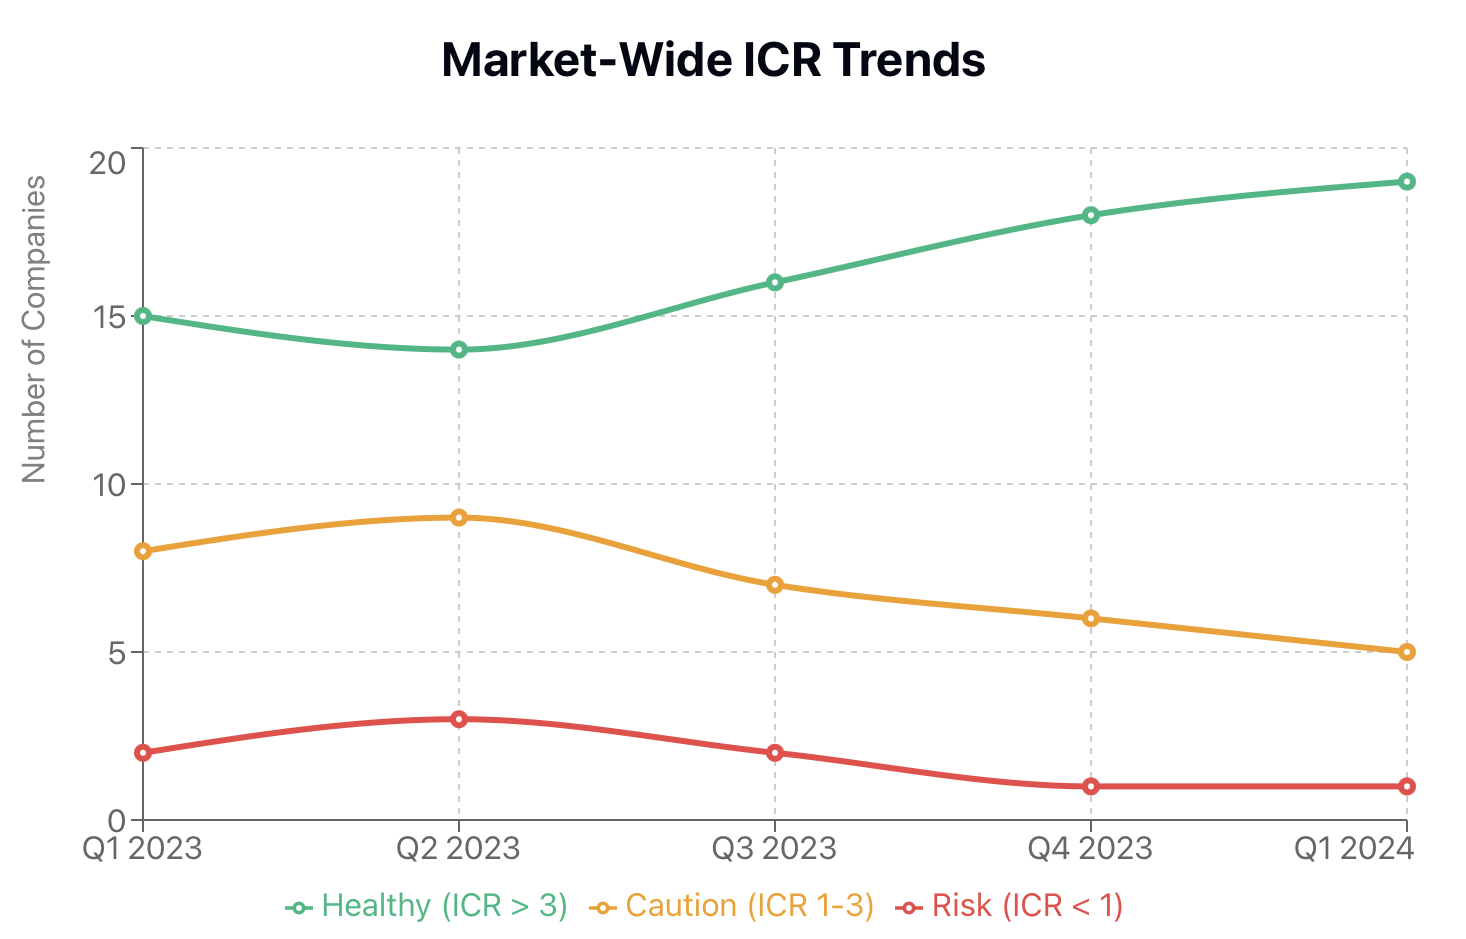
Companies who maintain a high ICR year over year generally have a more stable stock price. Investors are confident that these companies will be able to meet obligations no matter the economic environment or cycles. When companies see their ICR drop over multiple quarters, stock price generally shows a similar pattern, out of investors concern about the cash flows.
In the 2008 financial crisis, many companies saw ICR collapse as earnings fell dramatically while debt remained stable. Investors who had been looking at these ratios in previous quarters often were able to assess financial obligations - debt plus expenses, along with returns on earnings. High ICR companies proved to be more recession-resistant to the cash flow drop than lower ratios which were vulnerable due to existing financial burdens.
Technology companies like Apple and Microsoft's ICR are very high because their earnings are very high year after year. These companies may still have stock price volatility as growth becomes an issue, but they will always rely on financial positional strength as an undercurrent to investor confidence.
Looking at ICR over five or ten years with stock performance will tell a narrative as well. Companies that have improved ICR performance will often escalate the stock price, as perceived risk decreases as opposed to companies with deteriorating ICR that present an increasingly lower value threshold on investor sentiment towards potential redundancies in operations.
Top ICR Ratio Benchmarks Every Investor Should Know
Different sectors use different guidelines for what is considered a reasonable interest coverage ratio (ICR):
Technology companies: ICR greater than 10 are typical of profitable software and services companies with low capital requirements.
Manufacturing: ICR between 3-5 are common because of the capital-intensive nature and debt loads of this industry.
Utilities: ICR of 2-4 are standards because these companies have high debt, but cash flows are stable. Banking: banks operate differently, and ICR has less utility. Banks are more evaluated based on net interest margin and metrics more specific to banks. The average ICR for the S&P 500 is around 5-7, but it obscures a huge degree of variation among sectors.
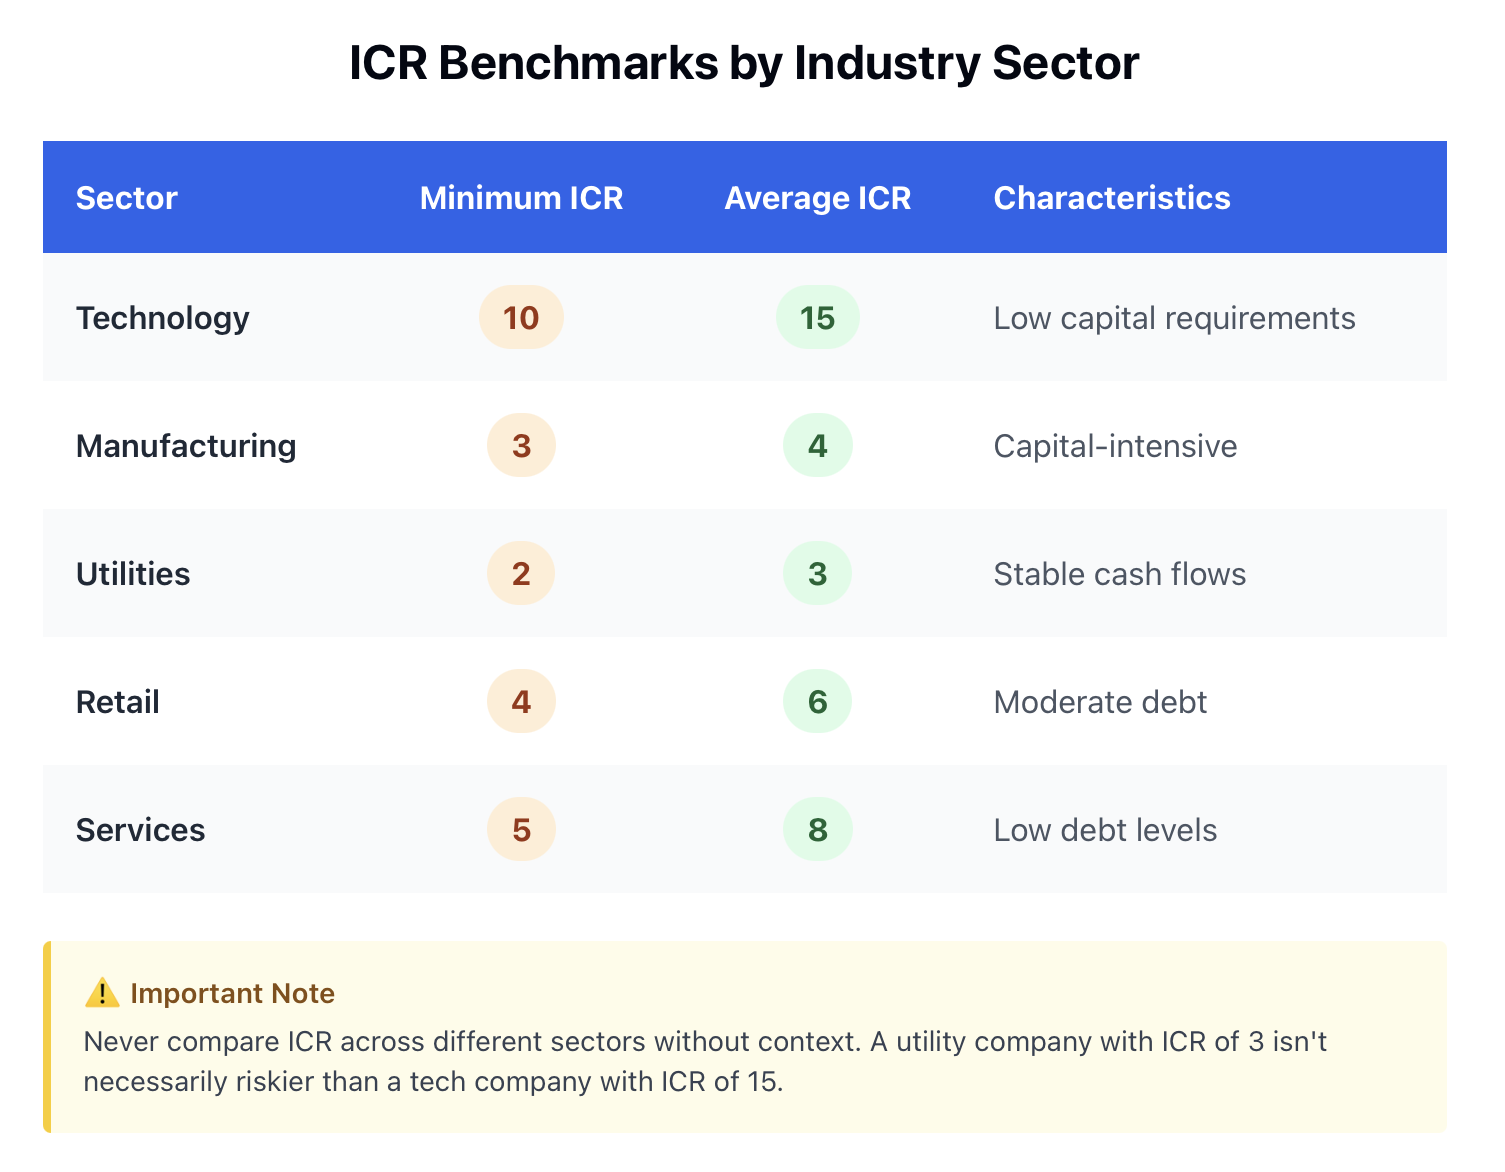
Do not compare a utility company ICR of 3 to a software company ICR of 15 to conclude the utility is riskier. The sector matters. When analyzing a company, compare its ICR with competitors in its industry. If all the companies in the automobile industry have an ICR greater than 4 and one has 1.5, then the one is an outlier in the industry and should be investigated further.
ICR Ratio in Financial Statements: Steps Needed to Evaluate
Locating the components associated with ICR in financial statements is not difficult once you know what to look for. Pull up an annual report or quarterly filing and navigate to the income statement.
You will see EBIT as operating income, operating profit, or actually EBIT. It will be below operating expenses and before interest and taxes. If the company does not separate out EBIT, then use net income and work backwards. For net income, add interest expense and income taxes back into net income.
You will usually see the interest expense listed separately below operating income in the statement.This encompasses interest on all types of debt, whether it's a bank loan, bond, credit facility, or capitalized lease. Some companies will note net interest separately, which will account for any interest income they earn on cash balances, so just make sure you're looking at the interest expense and not the net interest item.
Apple's financial statements provide nice examples of this. Apple labeled its operating income and interest expense separately, which makes calculating an ICR easy. Tesla's statements have also evolved into a more reader-friendly format as the company has matured.
Getting practice with real company numbers helps you to be less timid in the future. Pick a few companies you're interested in, download their latest 10-k annual reports, and calculate the ICR yourself. You will soon get a feel for where to look.
Using ICR Ratio for Assessment of Corporate Risk & Bankruptcy Survival
A declining ICR is one of the earliest red flags you can see from a distance stating this company might be in financial trouble. When operating income decreases and/or debt increases faster than the earnings, you're creating a situation where a company has an inability to properly service debt.
Companies that are filing for bankruptcy will almost always show record deteriorating ICRs in the years leading up to the bankruptcy filing. An ICR ratio may fall below 1.0, and in some cases, is seen below 0 where operating losses are occurring. At this point, the company is burning cash to pay an interest payment, which is not sustainable.
Using ICR and seeing other red flags creates the most fulsome picture.If a company is showing an ICR lower than 2, it has a debt-to-equity ratio over 2, its revenues are declining, that is a bad sign, but if it is also showing negative free cash flow, it is at serious risk of bankruptcy.
Recessions are a tough time for companies that have low ICR. As a company's earnings decline, lenders are less willing to refinance their debt, leading to a liquidity crisis, where a company can’t make its payments and doesn’t have the ability to borrow more money to pay the debt.
Another reason it is important for smart investors to monitor ICR is that they can see the trend in their portfolio of companies. If an investor has stock or bonds in a company, and sees the ICR declining quarter after quarter, that’s a sign that underlying fundamental problems might be developing.
Key Takeaways and Best Practices
ICR is one of the paramount measures of financial health and sustainability of debt; it tells an investor whether a company is generating sufficient earnings from their operations to be able to make interest payments.
It is calculated by EBIT divided by the interest expense. It is interpreted by looking at the industry and trends over time. Generally, an ICR greater than 3 is a sign of good financial health, while an ICR less than 1 is cause for concern.
Don’t rely too heavily on ICR by itself, consider other financial ratios as well when evaluating a company. A ratio like debt to equity, current ratio and free cash flow should all be also considered to get a well-rounded view of the financial health of a company.
Look at trends, and not just a single ICR number. An ICR of 4, that used to be an ICR of 8, should receive more scrutiny than a company that has shown the same ICR of 4 for years.
The ICR does not tell the whole story, a high ICR does not mean a company will always be successful, nor does low ICR guarantee that a company is going to fail. You must understand the context. It is important to understand the industry, their business model, and the assumptions about the future of the economic environment to draw conclusions.
ICR is useful to lower the risk of investment. It is reasonable to use ICR to screen for companies that are financially stable, potential problems in advance of a crisis, or where to invest your money.
Are you now ready to take ICR analysis to the application stage? Create a practice account to begin evaluating real companies using professional-grade financial analysis tools - the place to practice is safe, using existing live companies, learning all along the way.