


What Is a Golden Cross in Stocks? The Complete Beginner's Guide to the Golden Cross Stock Signal
If you have ever looked at chart patterns for any length of time, you have likely heard traders discuss the 'golden cross' stock signal as if it were the Holy Grail. The reality is that there is a reason for all the excitement surrounding this signal.
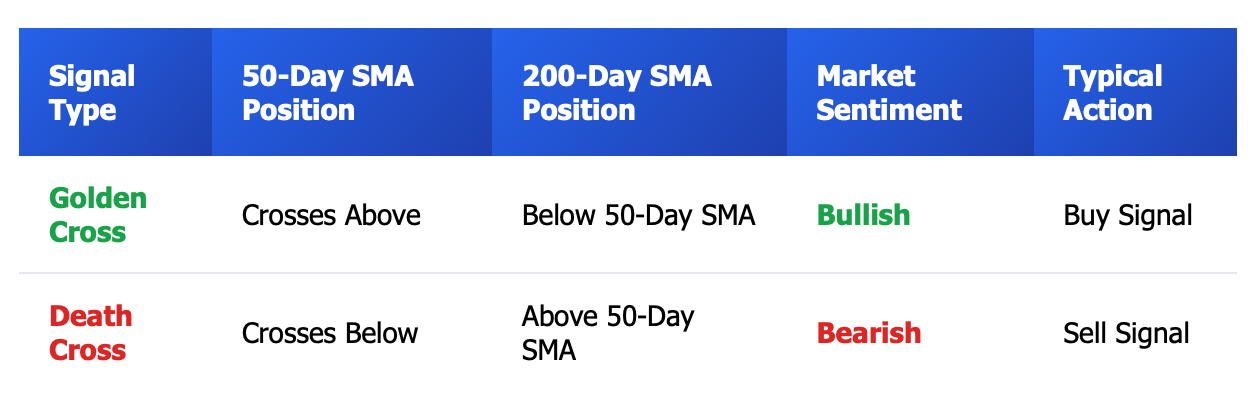
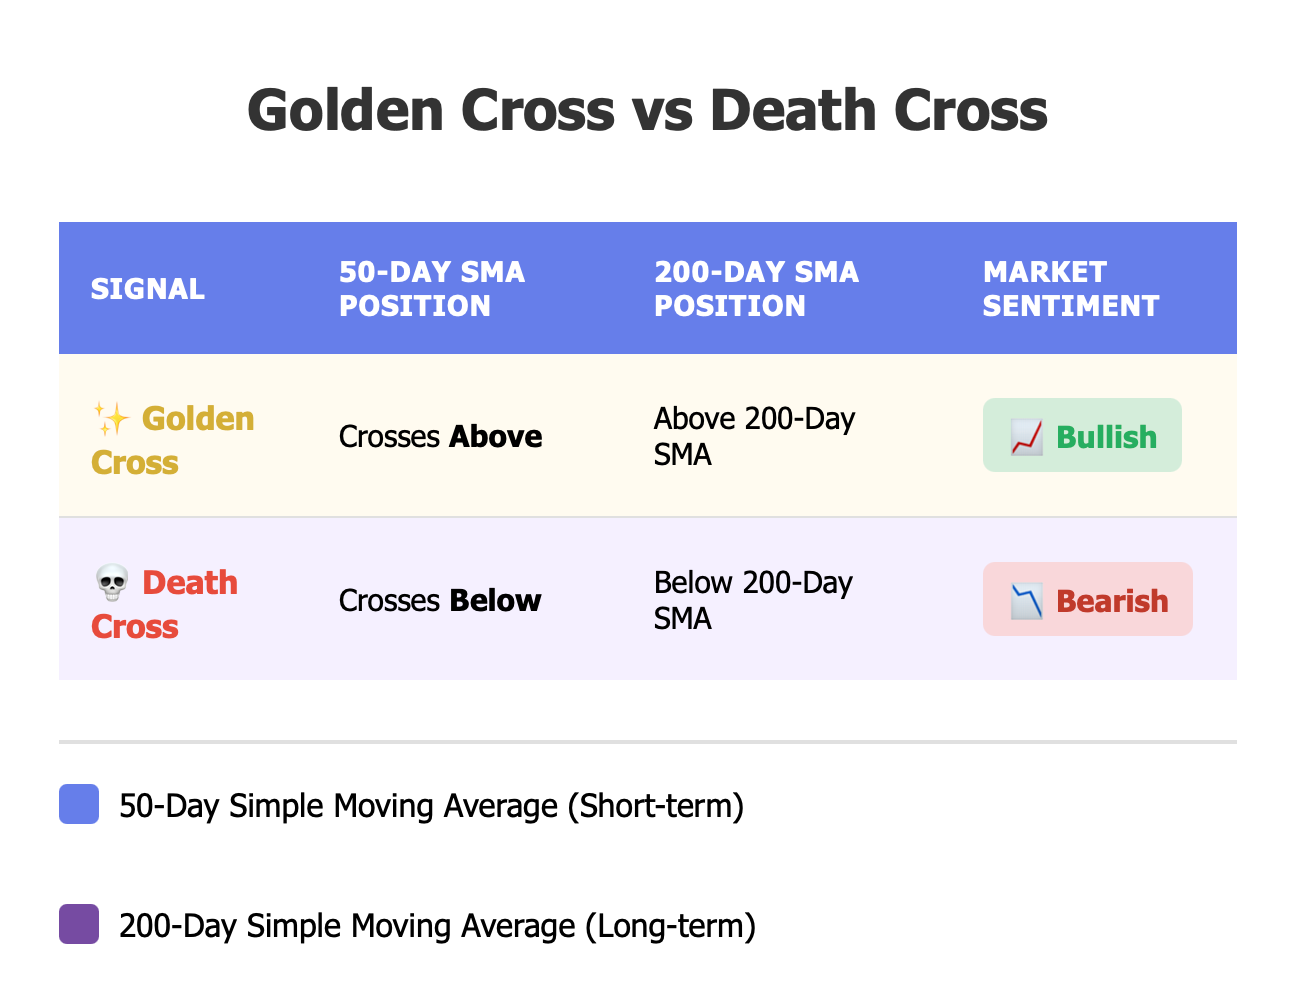
The 'golden cross' occurs when a stock's 50-day simple moving average (SMA) crosses above the stock's 200-day SMA. You can visualize this as two roads converging into one road: The faster (50-day) moving average road has just overtaken the slower (200-day) moving average road; thus, it shows that the stock's short-term momentum has overtaken its long-term trends. When this occurs, many traders interpret this as a green light that the stock is about to transition from bearish to bullish.
Many traders look at this chart pattern because it provides an assessment of the overall mood of the market. When the 50-day SMA rises above the 200-day SMA, it indicates that prices are consistently higher than they were in the prior several months. This type of buying pressure does not occur without an intentional effort by a trader or investor. Long-term investors, hedge funds, and trend-following algorithms use this Chart Pattern to help identify when momentum is developing.
In 2019, Apple (AAPL) soared by more than 80% after forming a Golden Cross early in the year. Similarly, in May 2020, after crashing due to the COVID-19 pandemic, the S&P 500 Index created a Golden Cross and experienced a tremendous bull market rally.
On the other side of the Golden Cross, there is also the Death Cross; the Death Cross appears when the 50-day simple moving average crosses below the 200-day simple moving average and typically indicates weakness in the market. The Golden Cross indicates that bulls are taking control, while the Death Cross suggests that bears may be waiting to pounce.
One important point to note is that while a Golden Cross does indicate an opportunity to enter into a position, it is not a guarantee of success. Many traders will make the mistake of using only a Golden Cross for their trade signals and will make trades without waiting for any volume confirmation, price action confirmation, and sometimes even using their research into the fundamentals of the underlying asset. If you do not wait for these confirmations, it is possible to enter into a false signal that will reverse before you realise what happened.
The golden cross is a trend-following signal, not a guarantee. But when used correctly, it's one of the most reliable tools in technical analysis.
Why the Golden Cross Works: Market Momentum, Trend Psychology, and Institutional Behavior
Why does the golden cross work? It does not work due to chance or magic; it works because of the way markets behave based on people's psychology and the way that many investors watch for the same signals at the same time as other people.
When you look at the moving average of a stock, you are looking at how many people have been buying at prices above and below the "fair value" of a particular stock over a specified period of time. When the amount of time it takes to forget about a stock reaches the point of the number of days is greater than 200 days, it means that there has been a steady increase in price over time due to increased demand from investors. The increase in price for the stock and the ability to predict that more and more investors are coming into the market are indicative of momentum.
For example, when you are walking down a street and see a long line of people waiting to enter a new restaurant. You have no idea what the restaurant serves, but the large number of people waiting at the door leads you to believe the food must be really good. The signal for the golden cross works on the same principle. When traders see that a stock has crossed above its average (the golden cross), they think that the stock price is about to continue rising. As a result, they begin to buy, thinking that other traders will also want to buy, creating a self-fulfilling prophecy.
For institutional investors, the golden cross is a great indicator, as it relates to trend following. Typically, index fund, pension fund, and hedge fund managers look for the direction of the trend using moving average crossovers when they want to increase their equity exposure in the market. When there is a golden cross on a major index like the S&P 500, billions of dollars will enter the market as these institutional investors will rebalance their portfolios.
In addition, it is believed that stocks tend to have very low volatility before a major shift in the trend. Before a significant change in direction, stocks often have a history of trading within a narrow range with little to no movement. It is during periods of low volatility that significant price movements occur as a result of the golden cross.
As an example, we can look at the golden cross of Bitcoin in 2021 when the signal appeared for the first time in February and then a few months later the price of BTC had increased to more than $60,000, hitting an all-time high. During this time, social media sentiment increased dramatically and trading volume surged, leading to even more people wanting to participate in the asset class.
Most of the time, the golden cross is an effective indicator because of the overwhelming number of participants in the market who utilize it. Additionally, if enough market participants act on the same signal, the price will move in that direction. Although the golden cross cannot be used as a stand-alone signal, the odds are in your favor when you combine it with good money management practices and applicable confirming indicators.
Golden Cross Trading Strategy: How to Find High-Probability Buy Entries
The appearance of a Golden Cross on your price chart indicates a potential bullish market trend, but this does not mean that you are to buy immediately without consideration. The timing of your entry after a Golden Cross stock signal is critical; getting it wrong means you will end up chasing the stock's price and potentially watching it turn back toward previous levels. Conversely, getting it right allows you to ride the upward trend with confidence.
Professional traders have three major strategies they employ when entering positions after a Golden Cross signal:
1. Buy immediately after the crossover – Quickly buying immediately after the crossover occurs with confirming volume, and the stock passing through resistance. The disadvantage of this strategy is that you may be buying near the top of the initial price increase.
2. Wait for a pullback to the 50-day SMA – Waiting for the stock's price to pull back to its 50-day Simple Moving Average (SMA) before buying; this is usually considered a safer approach due to the price often retracing down to the 50-day SMA to test that average before moving higher in price. Therefore, you can think of this strategy as waiting for the basketball to bounce once before catching it. Waiting for the price to pull back after a Golden Cross will allow you to place your entry at a better price and with less risk involved.
3. Enter on a breakout above recent resistance – Watching for the stock to break out through prior resistance levels before entering your position; after they consolidate around the resistance levels, there is added confirmation that there are serious buyers of the stock.
An excellent professional example of this might be seen with Nvidia (NVDA). After establishing a golden cross in early 2023, NVDA pulled back to its 50-day simple moving average ('SMA) and then made another run to a new high. Traders who were able to wait for this pullback received a much better entry price than those who entered immediately following the crossover.
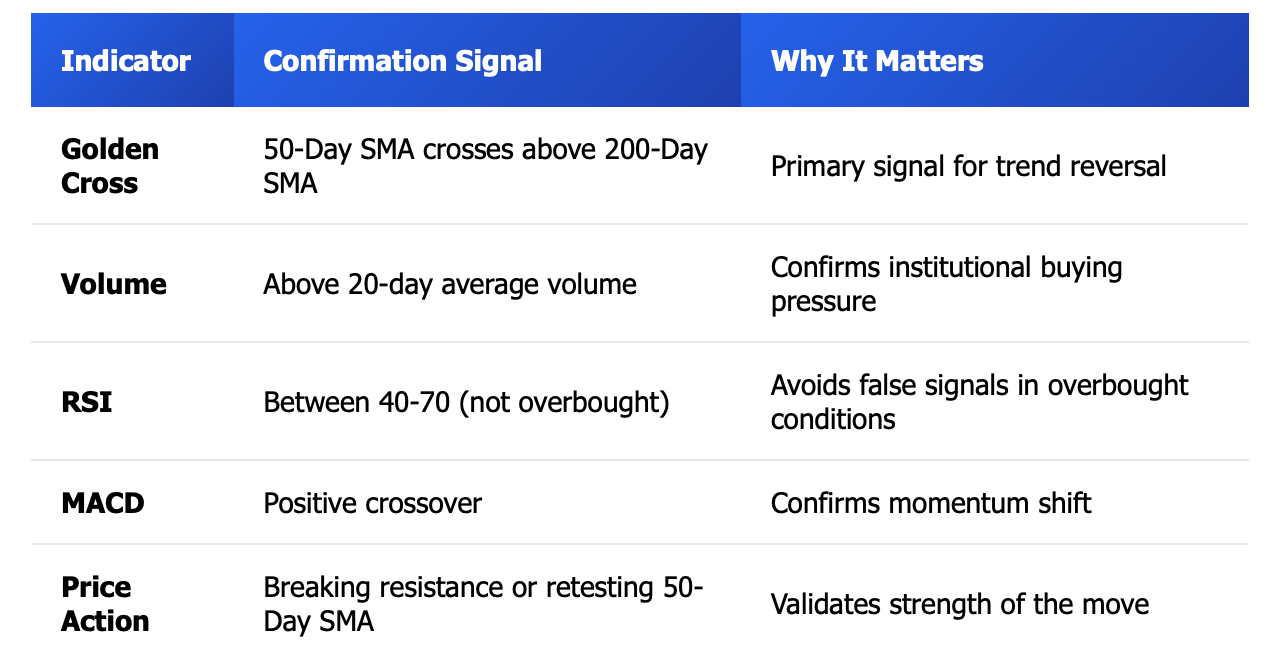
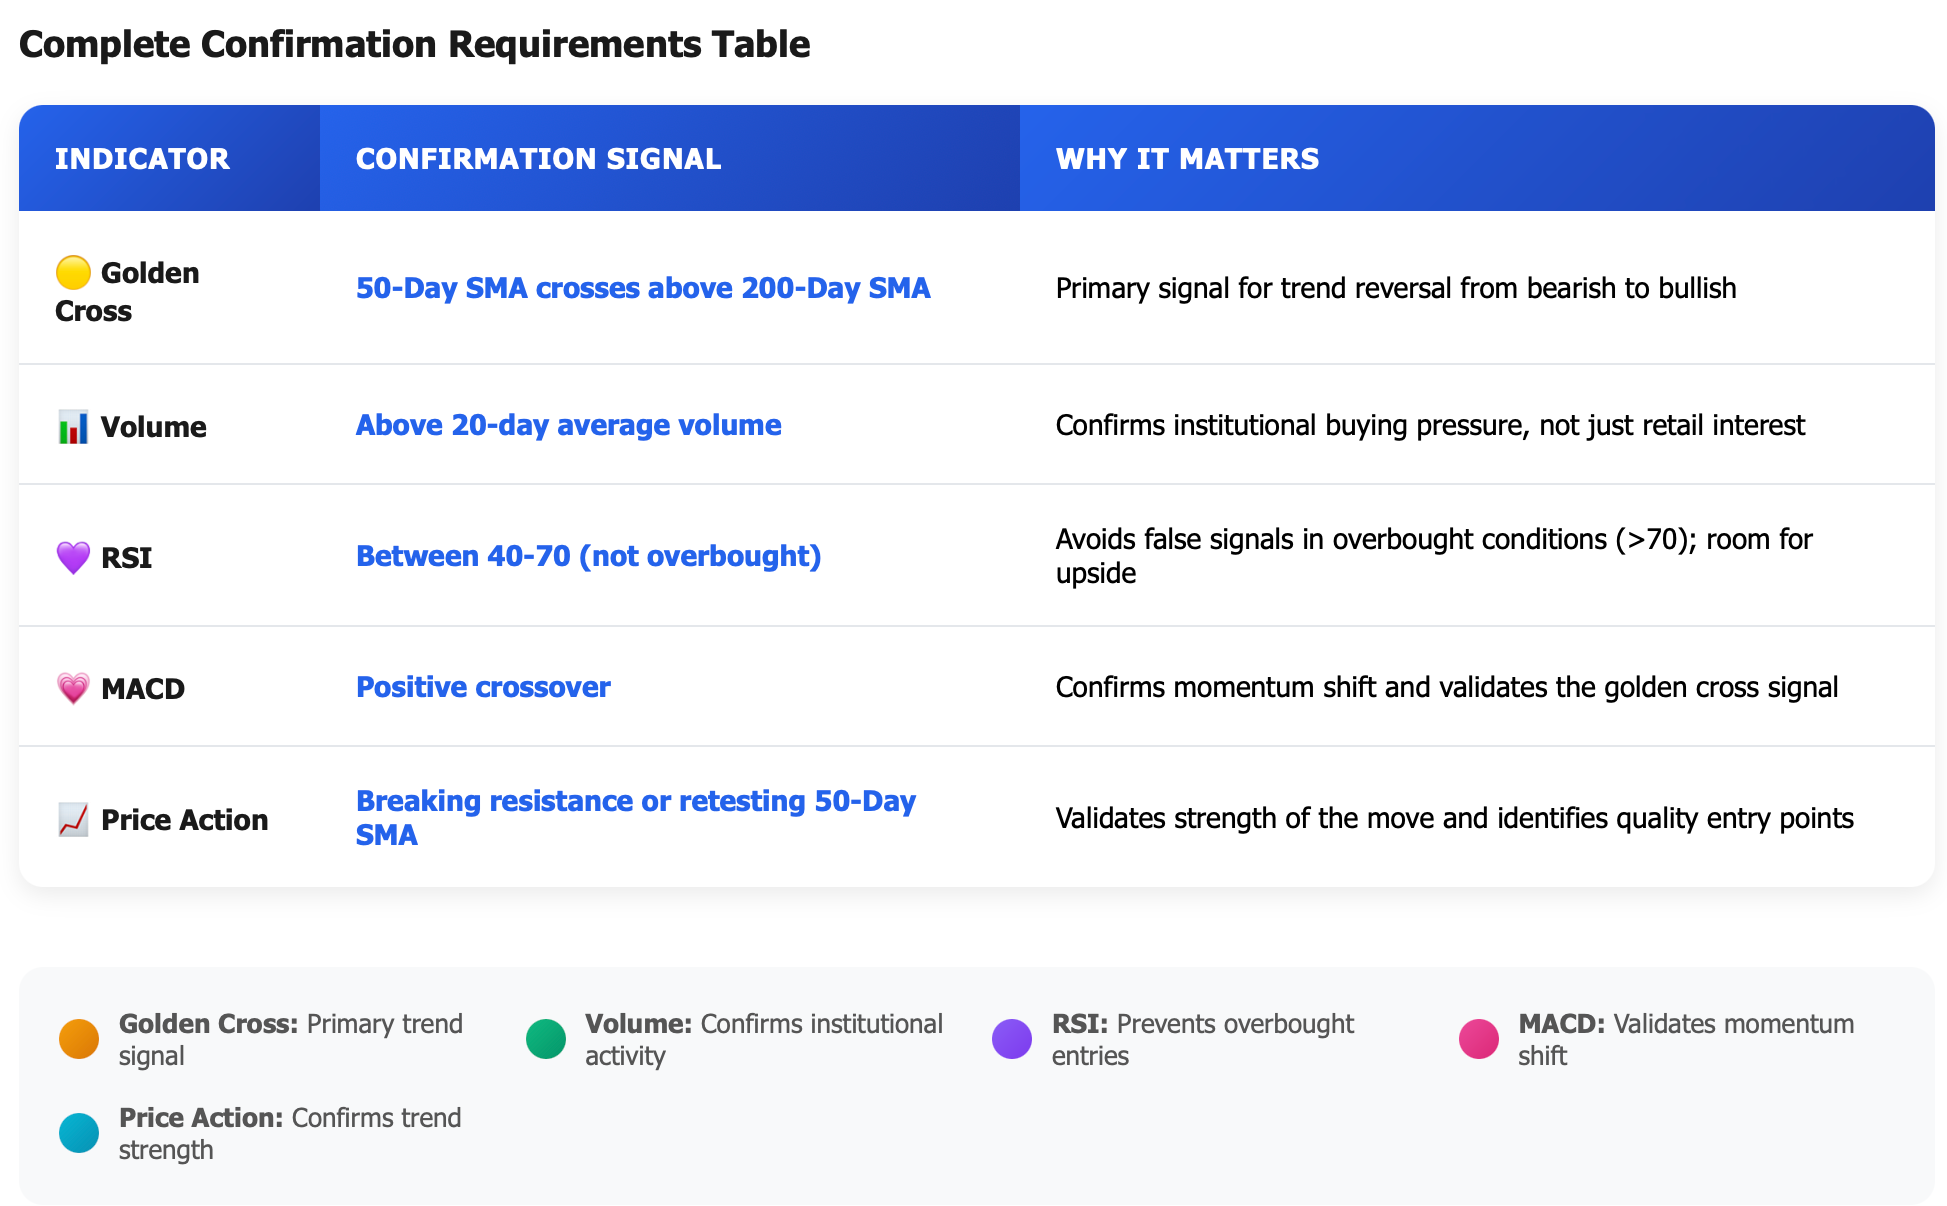
However, it is not sufficient to rely solely on the golden cross. There should be additional confirmation by using some other indicators:
-
Relative Strength Index ('RSI') – Always ensure that the RSI is not at overbought levels (greater than 70). If the RSI is overbought, wait for a cool-down period.
-
Moving Average Convergence Divergence ('MACD') – Look for the MACD line crossing above the signal line for further confirmation.
-
Volume – A golden cross that occurs with low volume is equivalent to an empty gas tank on a car. If there is no volume, then it is unlikely that there is strong buying pressure to validate the golden cross signal.
Don't fall into the trap of false confirmation caused by low-volume periods. If the crossover occurs during holiday trading or in after-hours, wait for normal market activity before making your commitments.
Remember: the golden cross is the signal, not the entry. The entry comes when you have confirmation that the trend is real and sustainable.
Golden Cross Stock Strategy: Best Stop-Loss and Take-Profit Levels for Safer Trading
Let’s face it, no matter how good the golden cross stock signal appears to be, it is highly possible that you can find yourself on the losing side of a trade, very quickly. That’s why stop-loss orders are not optional; they are mandatory!
How do we go about setting up our stop losses? There are 3 time-tested, proven methods for setting up stop losses.
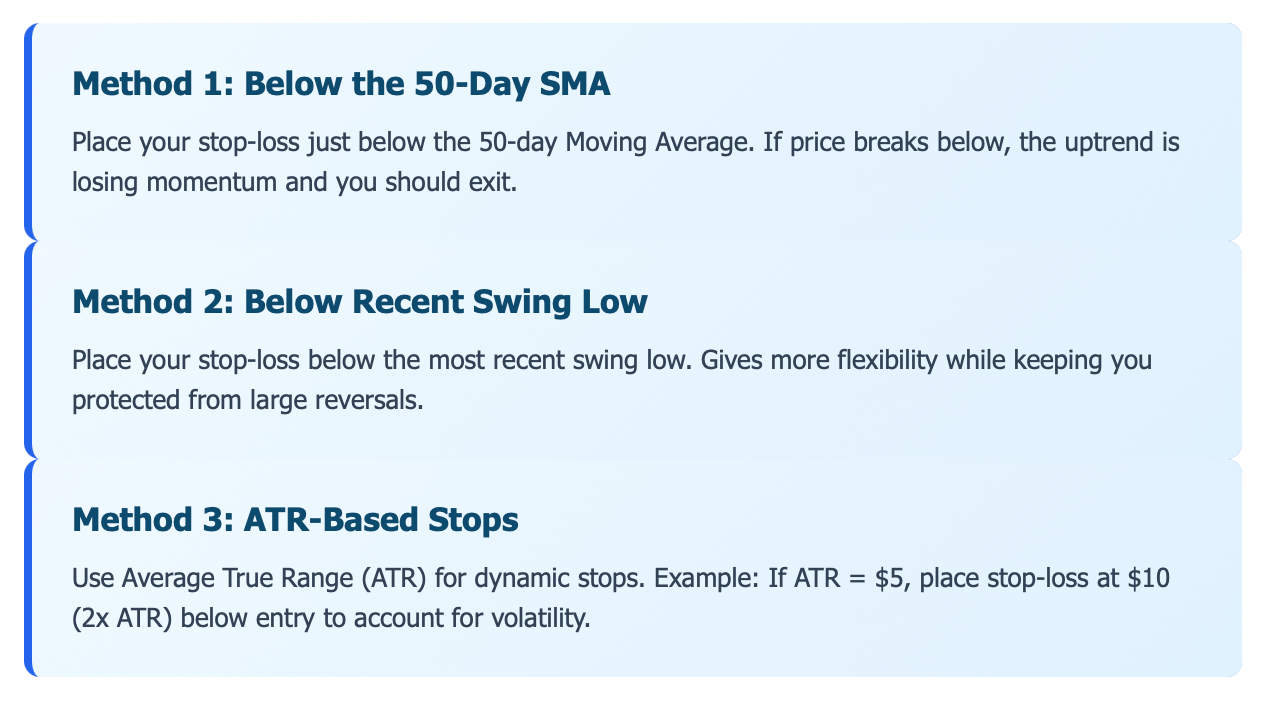
1. Below the 50-day SMA – Place your stop-loss just below the 50-day Moving Average Line (SMA) on your chart. If the price breaks below this line again, it indicates that the uptrend is losing momentum, and you should exit this position and protect your remaining capital.
2. Below the recent swing low – Place your stop-loss below the most recent swing low of price action. This gives you a little more flexibility in your trade, but it keeps you protected from a large price reversal.
3. ATR-based stops – Use the Average True Range (ATR) to set dynamic stops for your trades. Using an example, if the ATR equals $5, then I would place my stop-loss $10 (which is 2x the ATR) lower than my entry. This will account for the stock’s volatile nature and will help keep me from being stopped out of my position on a standard price swing.
Think of your stop-loss order as a safety net underneath a tightrope walker. You don’t expect to fall, but just in case you do, it’s there!
Now let's talk about taking profits. There are two main approaches:
-
Fibonacci Extension- the 1.618 and 2.618 extensions typically provide profit-taking levels on a positive stock move. If the stock has moved 20% higher (from purchase), using the 1.618 price extension would indicate an additional 30% price potential. Scale out of the position as the price reaches each of those two extensions.
-
Old Resistance Becomes New Support- former resistance levels are frequently future support levels, and vice versa. If the stock has had trouble breaking through to new highs at a specific price (for example: $150) in the past, this level is a reasonable place to exit some of the position.
Professional Trading Strategies involve "scaling out" of a position. For example, a trader might sell off 1/3 of a position at the first target price, another 1/3 at the second target price, and let the remaining 1/3 of the position run using a trailing stop order. This allows the trader to maintain gains but remain engaged in the upward trend.
For example, take TSLA, which became a well-publicized example of a growing company. After forming an established "golden cross" pattern in 2020, TSLA moved up more than 700% in value.
Professional traders who implemented trading strategies based on average true range (ATR) relationships avoided being shaken out of their positions when the stock experienced normal levels of volatility and were not affected as much during the inevitable pullbacks in TSLA, while those who did not use any form of stop orders were crushed with losses during the pullbacks in TSLA.
Each trade should have a risk/reward ratio of 2:1, with the preferred order of risk/reward at 3:1 or higher. For example, if you risk $1 per share, you should be trying to make $2-$3 or more on that trade. If the potential gain is lower than that, it is not worth making the trade.
Sample Risk-Reward Setup
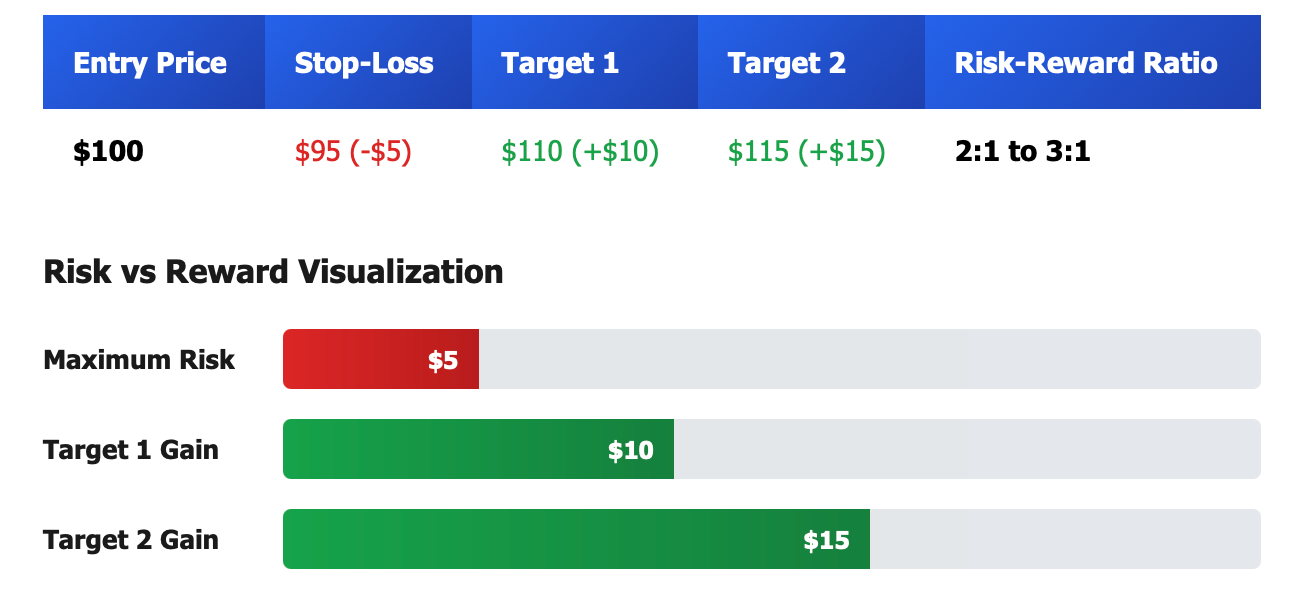
The golden cross only works when your risk is capped. Without proper risk management, even the best signals will blow up your account.
Golden Cross Stock Backtest: Historical Win Rate and Long-Term Performance Analysis
Backtesting is analogous to reviewing and analysing the previous season's games in order to determine which plays produced the greatest amount of scoring.
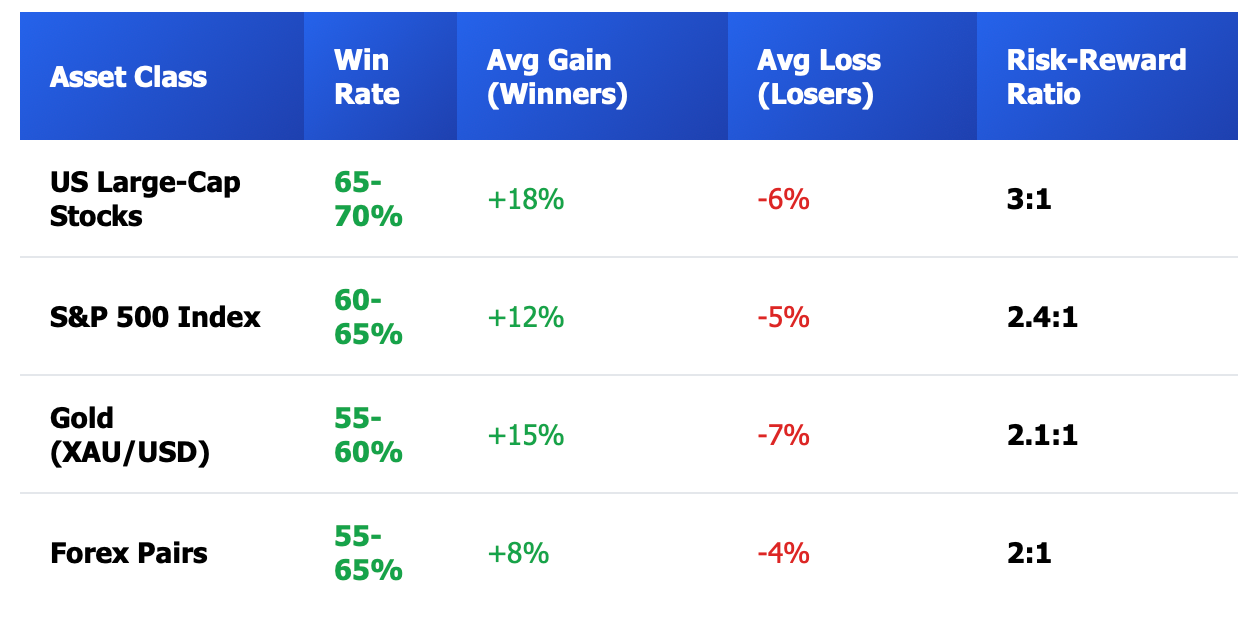
The data from backtesting the golden cross as a stock signal across several markets and different time periods reveals that the golden cross has demonstrated a degree of consistency. For example, historically, the golden cross has shown a win rate of between 60%-70% over the long term when applied to US large-cap stocks and major indices (such as the S&P 500).
Therefore, by taking advantage of every golden cross signal, it is highly likely that investors will generate profits on approximately two-thirds of their trades when proper risk management practices are followed.
Below is a summary of the data regarding the effectiveness of the golden cross signal.
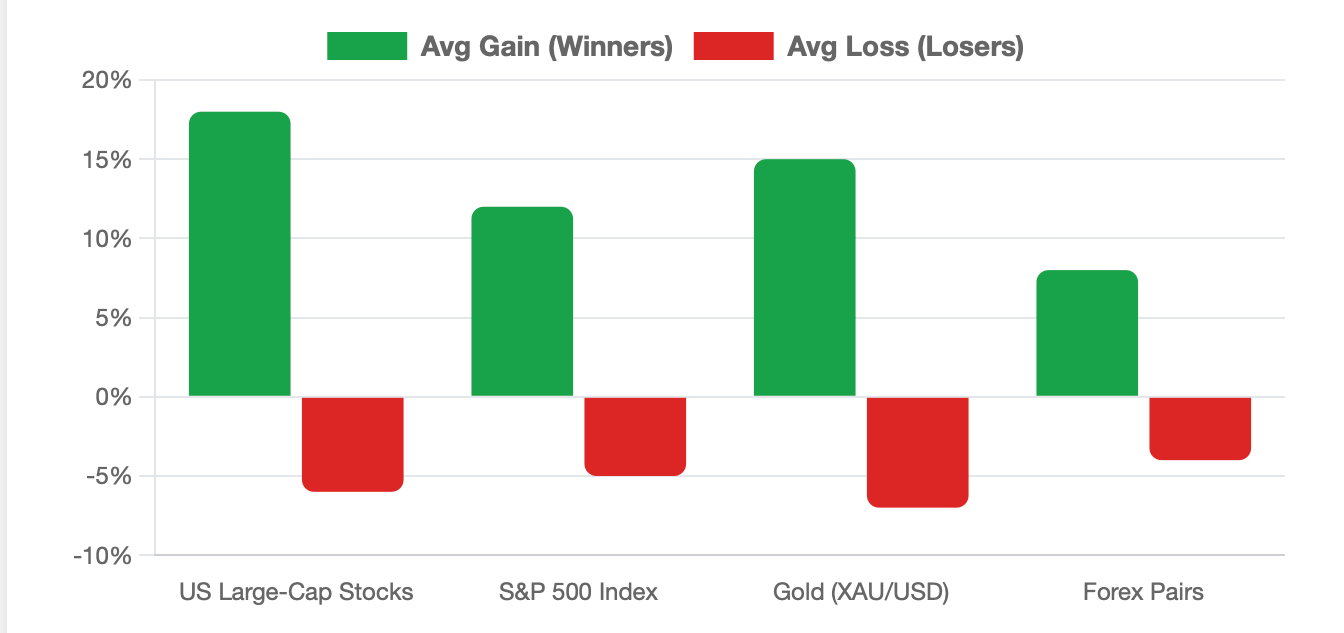
S&P 500: Since 1950, the S&P 500 has formed numerous golden crosses, and in the aggregate, the returns generated by the S&P 500 after the formation of a golden cross were higher (by between 3% and 5%) than the returns generated by a typical buy-and-hold investment strategy. In addition, the golden cross signal has been particularly effective when the stock market is recovering from a bear market or major correction.
Gold (XAU/USD): The golden cross signal has historically provided a reliable opportunity for traders who trade gold, especially during the trending phase of the price of gold, and the signal appears to have provided the greatest opportunity for profit-making. The golden cross signal underperformed in relation to the opportunity presented by the price of gold, and it has provided the least opportunity to trade profitably during the consolidation phase in the price of gold.
Foreign exchange: Forex pairs have an average win rate of about 55% - 65%. This is lower than that of stock trading because forex has greater volatility than stocks.
We're discovering that the golden cross signalling method provides traders with the best trading returns when the market is trending up and down, and it has the worst trading returns when the market is sideways. When markets are not moving in a clear direction, there will be frequent false breakouts (or "whip-saws") of the two moving averages crossing back and forth through each other.
Another important factor is to have strict stop-loss rules. Without stops, there can be extremely long drawdowns of losing trades that will eliminate months of profit. However, with stops in place, traders are able to limit their losses quickly and keep their capital for the next opportunity.
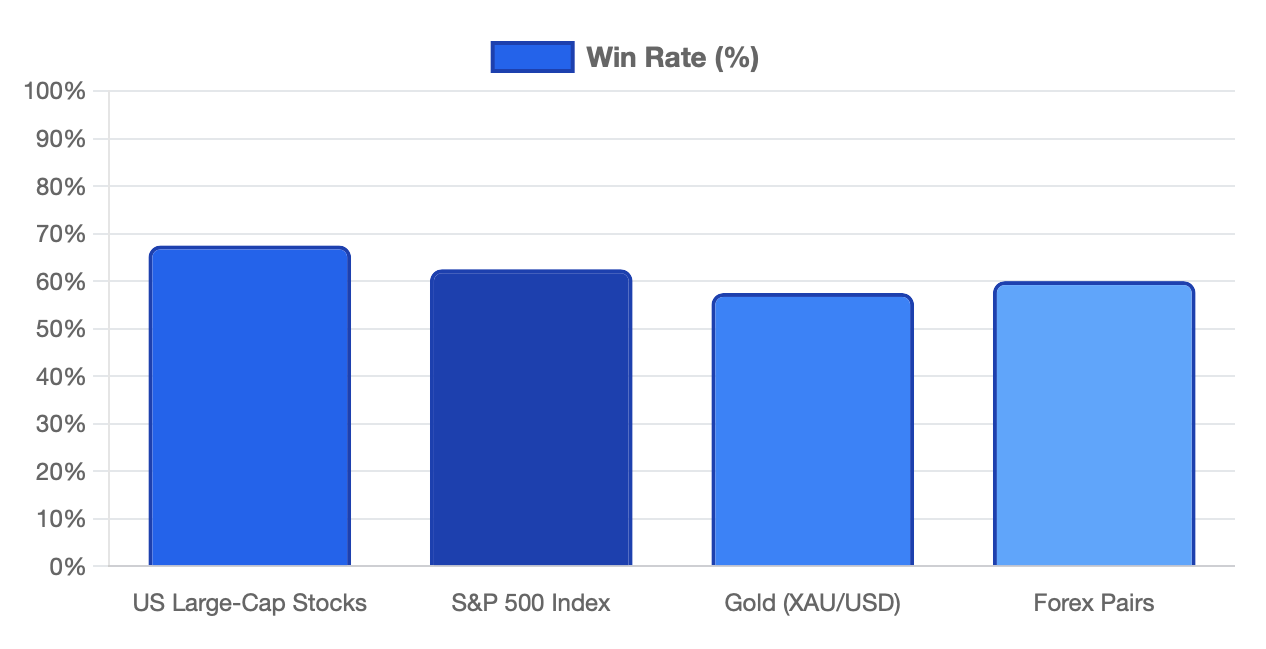
Win Rate by Asset Class
Understanding that the S&P 500 Golden Cross is extremely significant: In June 2009, following the worldwide financial crisis of 2008-2009 (the "Great Recession"), the S&P 500 Index formed a disseminated Golden Cross. For the next ten years, the S&P 500 generated annualized returns greater than 15% under these conditions. Therefore, any trader who took that signal and remained disciplined throughout the subsequent period saw increased wealth and substantial life-altering gains.
The Golden Cross does not simply reflect "tricks of the trade" (i.e., something that doesn't truly exist), but it is empirical evidence that demonstrates consistent success over an extended time period, provided there are sufficient movement trends in the US stock market. Hence, adopting a selective approach by avoiding trading during stock market "range-bound" movements will lead to significant improvements.
How to Combine Golden Cross Signals with Fundamental Analysis (Revenue, Margins, Growth Drivers)
Most traders focus primarily on technical signals; however, savvy traders understand that the fundamentals will ultimately tell you whether there is an opportunity for a quick spike in price or an opportunity to enter a sustained uptrending market. The golden cross stock signals are similar to a nice-looking sports car without an engine; while they have aesthetic value and may get your attention, they are useless without a means of propulsion.
The following is a summary list of essential elements to check for when combining technical signals with fundamental signals:
Growth of Revenue – Is the company increasing sales? Companies experiencing flat or declining revenue growth will produce a golden cross signal that could be construed as a "dead cat bounce." Smart investors should look for consistent year-over-year sales increases of at least 10-15% for growth companies and steady increases for mature companies.
Expansion of Gross Margins – Companies that are growing gross margins tend to be increasing their efficiency, while the opposite is true of companies whose gross margins are declining; therefore, declining gross margins could indicate either pricing pressures or an increase in costs, both of which will hurt the bullish trend.
Customer Acquisition Cost (CAC) v Lifetime Value (LTV) – This ratio is especially important for technology and software as a service (SaaS) companies. If a company is spending more on CAC than the expected LTV of new customers, that company will be unable to sustain its growth.
New Product Cycles – Companies that are launching new products or entering new markets can use these events as a catalyst to continue the momentum that was initiated by the golden cross.
Let’s take a look at AAPL (Apple) to illustrate our point. Early in 2019 (January), when AAPL’s stock created a “golden cross,” it was not only a continuation pattern, but it was also a bullish signal based on solid performance. In fact, during that period, AAPL reported record-breaking revenues in its iPhone business, increasing revenues from services, and record profit margins. Therefore, the golden cross coincided with the company reporting some of the strongest fundamental business results in AAPL's history. As a result, the price of AAPL skyrocketed.
Now observe the opposite - Companies whose stocks create “Golden Crosses” while simultaneously seeing declining earnings; although the stock may experience a small rally based on a technical signal, it will likely fall back to previous levels due to a lack of fundamental support.
This could be compared to preparing for a road trip. When preparing for your road trip, you look at both the weather forecast as well as your vehicle’s condition. However, if either the weather is not good or your vehicle has mechanical issues, no amount of good GPS directions will help you reach your destination.
Technical + Fundamental Alignment
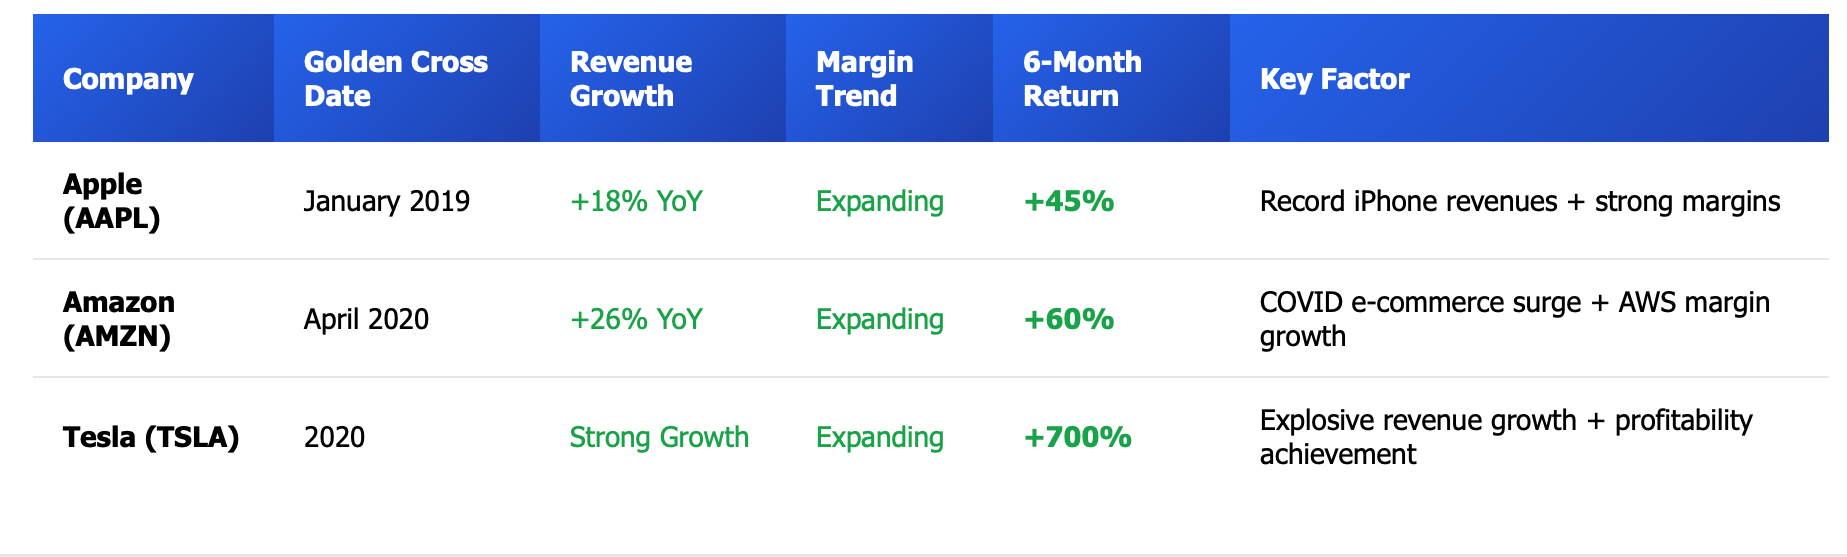
Another classic example of Amazon's golden cross was seen during COVID-19. The signal appeared in April 2020 when e-commerce demand skyrocketed; at this time, revenue increased 20%+ year-over-year, AWS's growing margins created an increase in profitability for Amazon, and stock price doubled in a matter of months. The strongest aspect of the golden cross happens when both the technical trend and business growth align. If you see a golden cross but do not see strong fundamentals for the company, it is better to pass on this trade because more opportunities will arise.
Full Golden Cross Stock Trading System: Entry, Exit, Filters, and Risk Rules
Step-by-step checklist for trading the golden cross stock signal without getting emotional or second-guessing yourself:
Step 1: Confirm the golden cross – Wait for the 50-day SMA to close above the 200-day SMA. Don't jump the gun on intraday crosses.
Step 2: Check volume – Volume should be above the 20-day average. Low volume crosses often fail.
Step 3: Apply the trend filter – Make sure price is trading above the 200-day SMA. If it's not, the golden cross is less reliable.
Step 4: Wait for an entry trigger – Choose one of the three entry methods (immediate entry, pullback to 50-day SMA, or breakout above resistance).
Step 5: Place your stop-loss – Use one of the three methods: below the 50-day SMA, below the recent swing low, or based on 2x ATR.
Step 6: Set your take-profit targets – Use Fibonacci extensions or previous resistance levels. Plan to scale out at multiple targets.
Step 7: Execute and manage the trade – Once you're in, let the system work. Don't override your rules based on fear or greed.
Exit rules:
-
Exit 1/3 of the position at the first target
-
Exit another 1/3 at the second target
-
Trail the final 1/3 with a stop below the 50-day SMA
Beginner 3-Step Cheat Sheet:
-
Golden cross + volume confirmation = Signal
-
Wait for pullback or breakout = Entry
-
Stop below 50-day SMA = Risk management
Professional Multi-Indicator System:
-
Golden cross confirmed
-
RSI between 40-70
-
MACD positive crossover
-
Volume spike (1.5x average)
-
Fundamentals support trend
-
Entry on pullback with 3:1 risk-reward
Complete System Flowchart
-
Golden Cross Appears → Check Volume → If High, Continue
-
Price > 200-Day SMA? → If Yes, Continue
-
RSI < 70? → If Yes, Continue
-
Enter on Pullback or Breakout
-
Place Stop-Loss (Below 50-Day SMA)
-
Set Targets (Fibonacci or Resistance)
-
Scale Out at Targets
A system prevents emotional trading. When you have clear rules, you don't second-guess yourself. You execute the plan, manage the risk, and let the probabilities work in your favor over time.
Does the Golden Cross Really Work? Final Verdict and Best Practices for Traders
So does the golden cross stock signal actually work, or is it just another overhyped pattern? The answer is: it depends on how you use it.
The golden cross works best in:
-
Trending markets – When indices or stocks are in sustained uptrends, the signal captures momentum beautifully.
-
High volume environments – Confirmed volume means institutional money is flowing in, not just retail traders gambling.
-
Fundamentally strong companies – When business growth aligns with technical momentum, trends last longer and move further.
The golden cross fails during:
-
Sideways ranges – Choppy markets produce whipsaws that kill your account with false signals.
-
High-volatility news events – Earnings misses, Fed announcements, or geopolitical shocks can override technical signals.
-
Weak fundamentals – A golden cross on a dying company is a trap, not an opportunity.
The truth is that the golden cross is not some sort of magical formula for getting rich quickly. It's just one of many tools available to traders, but when it is combined with sound risk management practices, volume confirmation and fundamental analysis, it can become one of the strongest weapons in a trader's toolbox.
Top traders don't trade by only using one signal; instead, they create a better probability for profits by using multiple forms of analysis. The golden cross is just one of many signals, but it is a significant part of the overall trading strategy.
If you're serious about implementing the golden cross strategy, you should conduct a backtest on your own watchlist and see how it performs across various market conditions (bulls vs. bears). You will need to tweak your criteria to suit your personal risk tolerance and trading style, but most importantly, you need to maintain strict discipline. Once you begin overriding your trading plan based on emotions alone, you've lost your edge as a trader.
The golden cross will work for you when you put the time and effort into it. It is a very powerful tool, but only when used in conjunction with a set of specific rules, discipline, and patience.
Don't trade blind. Track golden crosses and other high-probability setups with real-time alerts and professional-grade tools at BTCDana.com. Whether you're analyzing stocks, crypto, or indices, we give you the edge to trade with confidence.