


Introduction: Why MFI is the Ultimate Market Efficiency Tool
Is the market truly strong or just appearing lively?
As a trader, you constantly face this question. You see high-volume trading, drastic price movement, and many indicators screaming buy me! But just because many traders are moving the price in one direction does not mean the market is moving efficiently.
RSI, MACD, and volume are traditional indicators used to indicate both the direction of the market and the speed at which the market is changing direction or moving. They do not indicate the level of efficiency in the price movement of the market; that is where the market facilitation index comes into play.
Consider pushing a shopping cart through a busy retail location. You have to exert a significant amount of force to push the shopping cart because you are continually running into obstacles. Therefore, the efficiency of the energy you apply to moving the cart forward is very low. In contrast, consider pushing the same shopping cart through an empty aisle of the same store.
You will still have to exert the same amount of energy; however, because there are no obstacles in your way, the cart pushes easily forward. The concept of the market facilitation index is a measure of the level of price movement versus volume, that is, the amount of price movement you get for each unit of volume traded.
Bill Williams, a renowned trader, designed the MFI. The MFI provides a measure of the strength and participation behind any price movement (indicating that it is a measure of the market's facilitation). You will learn each aspect pertaining to this unique trading tool in this guide, including how to set up your MFI chart, understand the way MFI works, and develop advanced systems for using MFI in stocks, currencies, futures, and CFDs. With this information, you will be able to better identify when trends begin, avoid false breakouts, and identify when reversals are occurring before other traders recognize these events.
MFI Core Definition: Understanding Market Facilitation Index
Bill Williams developed the MFI - Market Facilitated Index - that functions as a momentum oscillator. He claimed it was a simple and yet powerful tool to evaluate market price movement by providing an answer to the following question: "What is the efficiency of this price movement?" The formula is simply expressed as follows:
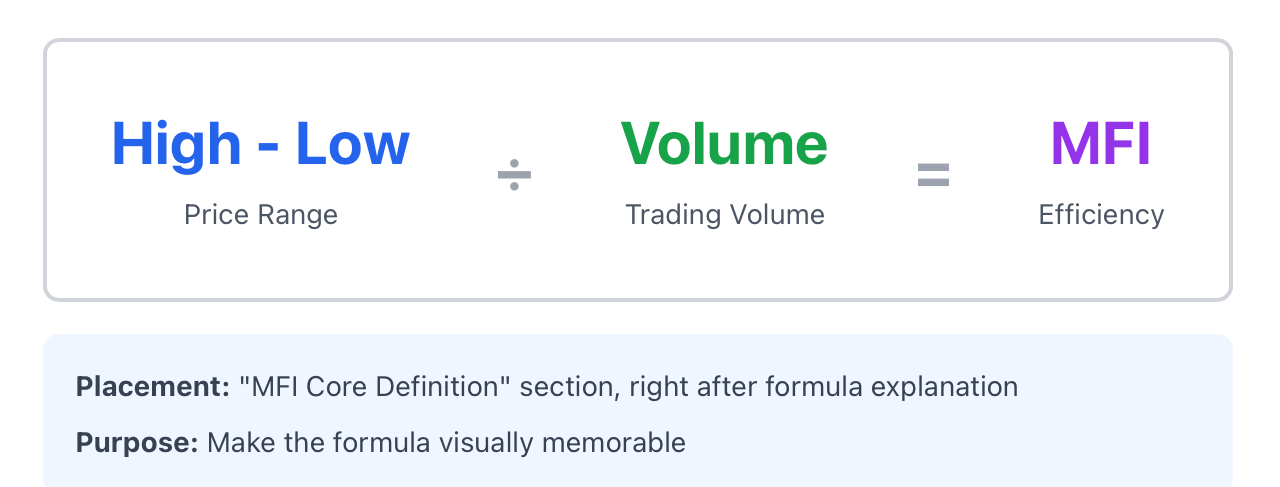
To derive MFI, we will use the "range" of the current candle (high minus low) divided by the volume of shares traded. The calculated MFI value indicates how much price movement the market generated for each unit of volume (i.e., the price moved $X for every $1 of volume).
If we have a high MFI, this indicates that a substantial amount of price movement occurred with relatively low volumes being traded in that candle. Thus, the market had a high level of efficiency, and all market participants were aligned. There is a clear path of least resistance for future price movement.
Conversely, a low MFI indicates that a large volume of shares created very little price movement in that candle. Therefore, the market was contested with participant disagreement. Thus, all pips and ticks in the market were hotly contested by participants.
There are three primary uses of the MFI in trading:
-
Assessing Trend Strength - In trending markets, there should be a repeated pattern of high MFI readings.
-
Filtering False Breakouts - when we see breakouts with low efficiencies, generally, they will fail.
-
Monitoring Participant Activity - if there is a large swing in MFI readings, this suggests there was a fundamental shift in the behaviour of market participants.
Lastly, please keep in mind: The MFI reflects the market's current efficiency; it is not a predictive tool with respect to where price movement will go next. Therefore, think of it as an additional filter for the trading signals you currently monitor.
The 4-Color MFI Bar System: Decode Market Signals Instantly
Bill Williams took the market facilitation index concept and made it visually intuitive by color-coding bars based on both MFI direction and volume direction. This creates four distinct scenarios, each with its own trading implications.
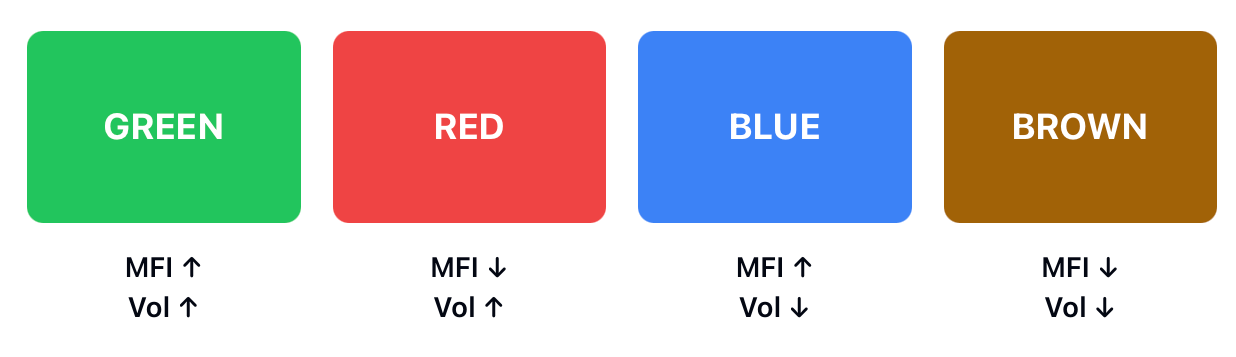
Green Bar: MFI↑ Volume↑
Both the market facilitation index and volume are rising. This is the holy grail situation. The market is gaining efficiency AND participation at the same time. More traders are joining the move, and they're all pushing in the same direction with minimal resistance.
Trading implication: This signals either a new trend starting or a strong trend continuing. Green bars are your confirmation that the market has momentum behind it. When you see consecutive green bars, the path forward is clear.
Brown Bar: MFI↓ Volume↓
Both the market facilitation index and volume are falling. The market is catching its breath. Fewer participants, less efficiency, less interest. It's like a rest day in the gym after an intense workout.
Trading implication: The market is resting or consolidating. This isn't the time to force trades or chase moves. Brown bars tell you to step aside and wait. They're not bearish or bullish, they're just boring. And boring markets chop up accounts.
Blue Bar: MFI↑ Volume↓
The market facilitation index is rising but volume is falling. Price moved with high efficiency, but where were the participants? This is the trap setup. It looks strong on the surface because the price range expanded, but the lack of volume means no real conviction backs the move.
Trading implication: High risk of false breakout. Blue bars often appear at breakout points where retail traders get excited and jump in, only to see the move reverse shortly after. Professional traders see the lack of volume and fade these moves. Blue bars are your warning signal to stay skeptical, especially in low-liquidity environments.
Red Bar: MFI↓ Volume↑
The market facilitation index is falling but volume is surging. Tons of participants jumped in, but all they managed to do was create a narrow range candle. This is a fierce battle between buyers and sellers, and nobody's winning.
Trading implication: This is a classic reversal warning, especially at tops or bottoms. When you see red bars after a sustained trend, it means the trend is encountering serious resistance. The old trend's supporters are fighting the new direction's advocates, and efficiency has collapsed. Red bars at highs often precede significant reversals.
The Quick Reference
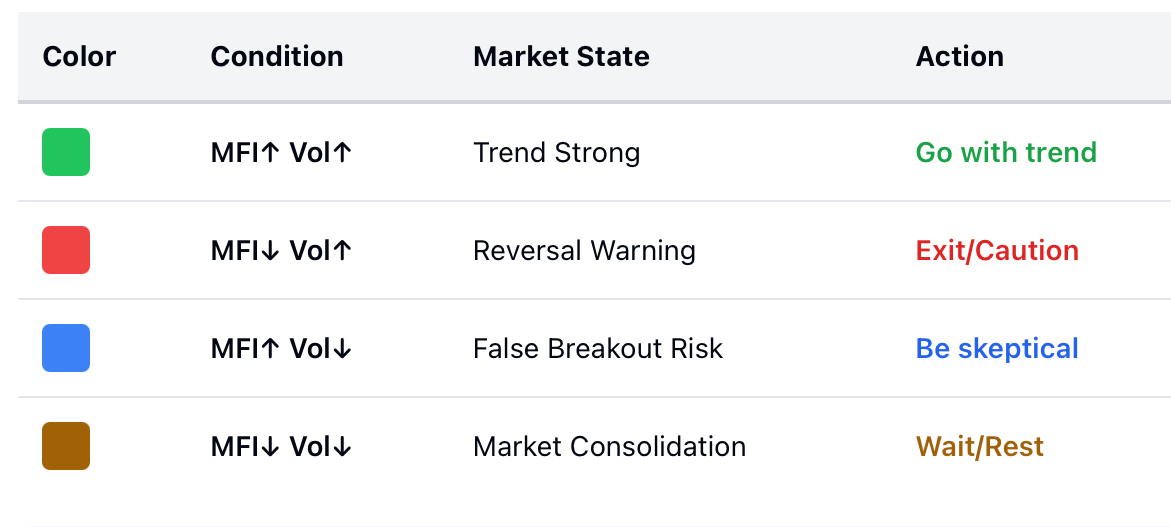
The blue and red bars are where the market facilitation index provides its most valuable insights. Green bars confirm what's already obvious. Brown bars tell you to do nothing. But blue bars save you from expensive mistakes, and red bars warn you before major reversals wipe out your gains.
MFI Across Markets: Forex, Stocks, CFDs & Futures Explained
The market facilitation index acts inconsistently between different types of financial markets. The reason for this inconsistency is not because the formula of the MFI has altered from one market type to another, but because the definition of "volume" varies based on the market in question.
The issue with Tick Volume
In Forex and CFD trading, platforms often only utilize tick volume as opposed to real volume. The problem with tick volume is that it's based solely on the number of times the price has changed, i.e., the number of ticks that occurred. For example, if the EUR/USD moves from 1.1000 to 1.1001, this is one tick. It doesn't matter whether this tick represents one contract or 10,000 contracts; it's still one tick.
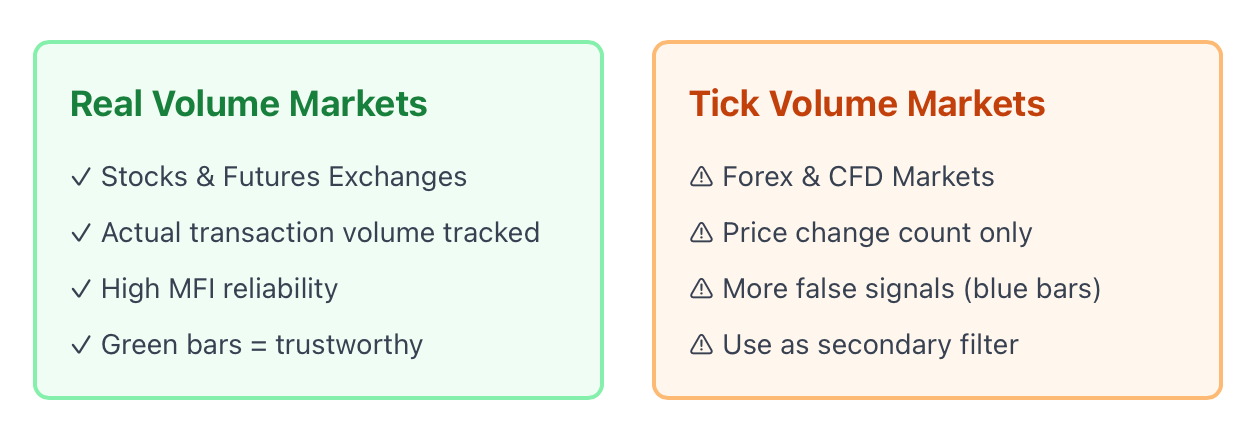
The issue with the MFI is that this creates market inefficiencies by distorting the actual volume. In Forex trading, there will be a greater number of blue bars indicating high MFI/low Volume since tick volume does not accurately measure the amount of participation in the market. Although these types of breakouts will appear to have good trend efficiency, without true volume, these types of breakouts are susceptible to reversal.
Real Volume Markets
Real transaction volume is tracked by the futures or stock exchange. The market facilitation index shows monetary transactions or ‘real’ money flowing through various markets by representing their cumulative amount by way of a green bar or bars displayed throughout the year. Conversely, the red bars in the major highs indicate that there is currently a struggle between "one institution" and another institution, and no one knows which institution will be the victor.
Comparing the difference in reliable information is very important. With regard to stock and futures exchanges, showing a green bar means it has a higher degree of reliability for validating the trend; red bars represent an area of intense competition, that is, the potential for reversal. The market facilitation index was created to measure volume, and therefore works best when volume is supplied.
Session-Specific Considerations
Some important factors regarding liquidity must be taken into consideration when interpreting the market facilitation index. For instance, during the Asian forex session, the liquidity is extremely thin due to a lack of volume. Therefore, during the Tokyo session, you will see a lot of blue bars indicating a high The frequency of blue bars does not indicate that traders are trying to set traps, but rather, there are not enough participants in the market to generate sufficient volume.
You will now compare the volume at the New York open to the volume of the S&P 500. At the New York open, volumes become extremely large; there is a clear level of efficiency and trustworthiness of the signals given by the market facilitation index; and, therefore, the green bar produced during the extremely high liquidity time frame is perceived to be of high value. On the contrary, the green bar produced during the extremely low liquidity time frame may simply be considered to be statistical noise.
Make sure you know your source of volume. If you're trading Forex or CFDs using tick volume, exercise extreme caution with blue bars and don't rely solely on MFI as your sole indicator. If you're trading stocks or futures using real volume, the market facilitation index will provide you with a solid confirmation in how to accurately evaluate what is happening in the market.
MFI strategies in practice: Determine trend initiation, continuation, and reversal points
Theory is of value, but what you're seeking to learn is how to effectively incorporate the use of the market facilitation index in your trading decisions. Below are three of the basic methods for taking advantage of the colors of the bars and translating that into profitable trades.
Strategy 1: Identify when a trend starts
The most reliable trading setups are found at the beginning of a trend, and you can use consecutive green colored volume bars to identify those initial setups. Whenever you observe two to three consecutive volume bars that are colored green after a time of either consolidation and/or brown colored bars, this indicates the market is accelerating higher in an efficient and participating manner.
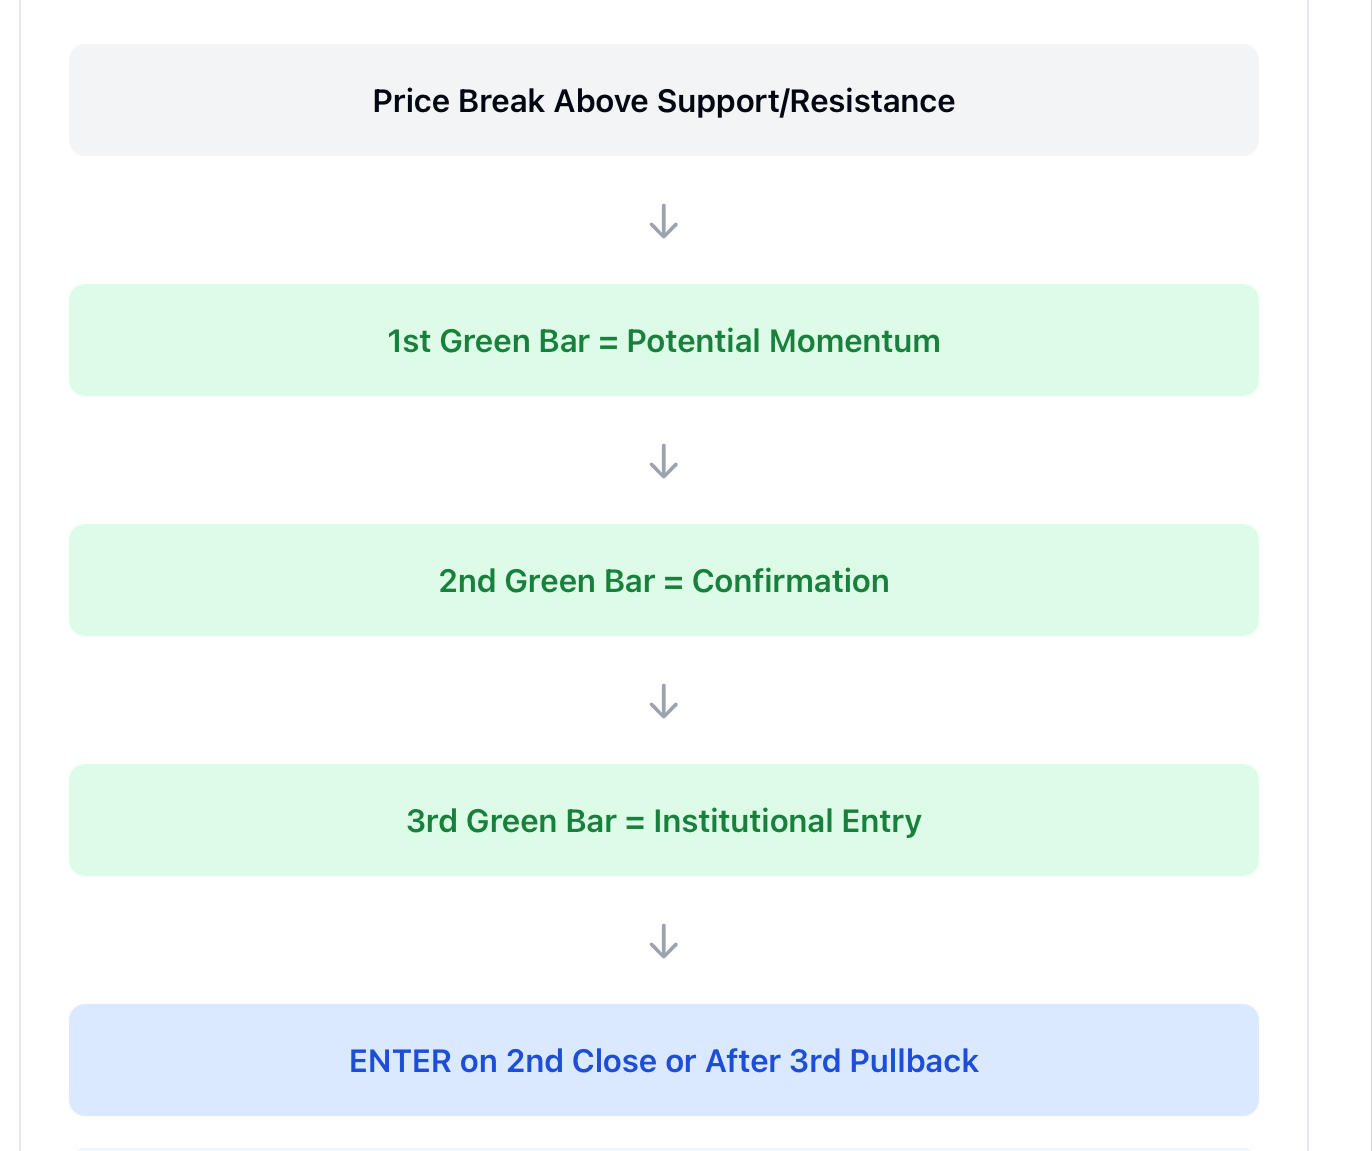
Setup: Look for an established price break above a support/resistance level and then wait for consecutive green volume bars. The first green volume bar indicates potential momentum, and the second green volume bar confirms it. The third green volume bar denotes when institutional traders have entered the market.
Entry on the close of the second green bar or on a pullback after the third green bar (below the first yellow bar). Do not delay excessively. If you wait until others have noticed the upward movement of the stock(s), you will have missed a substantial amount of your potential return-to-risk.
Example of S&P 500 Incidents: Price action in the S&P 500 index breaks out above 3-5 weekly highs. Day 1 price action is a red candle with significant volume (MFI↑), Day 2 has two follow-up green candles confirming the price continues higher. Potential entry point of the trend is defined in the range between the close of the Day 1 candle (green) and the Day 3 pullback candle. Thus, you have established that there is no such thing as a "hype" breakout; a bullish breakout can and will continue to move upward if it is supported by the institution (fundamentals).
Strategy 2: Trend Continuation After Rest
Trends are not always linear and will often take breaks, or "rest phases," as they consolidate to shake out weak hands before picking up their momentum and continuing their directional moves. A trader will look for the pattern of brown colored bars representing the rest phase and then for the reappearance of green colored bars (momentum resumes).
Basics: You are currently in a trade or watching a developing trend, and you suddenly see an emergence of brown colored bars on the screen. In conjunction with the appearance of these brown colored bars, both your MFI and volume decrease, and maybe the price even pulls back a little. This occurrence is not the trend dying but rather the market taking a breather.
Entry or add to position: Whenever you see a reemergence of green colored bars following a series of brown colored bars, this is your continuation signal. The market has been resting (in a state of consolidation), and the market is now beginning to experience "efficiency" and "participation" again. At this juncture in time, the seasoned trader adds to his positions, whereas the novice trader may have become spooked and exited his position too early.
Example: The price of gold is trending upward strongly. On a recent 10% run-up, the price displayed three brown colored bars, and during this time, the price was consolidating (sideways) for a period of one week (the rest phase). When a green colored bar appears next to the three brown (and an additional green colored bar also appears), the Market Facilitation Index would tell the trader that the rest phase is over, and the price trend is once again continuing upward. This point in time would constitute a very high probability to add to the position.
Strategy 3: Avoiding False Breakouts and Catching Reversals
This is the point at which the market facilitation index (MFI) delivers its value by identifying both failed breakouts and major turning points in the market's direction.
A Blue Bar as a "False Breakout" Setup: A key price level is broken, but the candle that confirms this breakout is blue (indicating increased MFI with decreased volume). There is a high degree of efficiency with very low participation, which results in an "amateur trap" (or "buy the breakout"). When retail traders notice the breakout and start buying it, smart money recognizes the absence of volume and sells (or "fades") this breakout.
What you should do if you find yourself in this situation: If you were not long before the candle turned blue, do not go long with the breakout. If you were already long when the candle turned blue, place your stop orders as close to the breakout candle as possible. The chances of this move failing are very high. Blue candlesticks that appear at breakout points indicate that these points were selling opportunities rather than buying opportunities.
A Red Bar as a "Reversal" Setup: After a long trend of increasing (or decreasing) prices, the market reaches an all-time high (or all-time low) but produces a red candle on the MFI (MFI = decreasing, volume = increasing). The number of contracts being traded has nearly doubled the volume that was produced with a narrow-range closing price on the candle. It is clear that sellers and buyers are engaged in a heated battle at these new extremes, and therefore, the chances of the market continuing in this direction are greatly diminished due to the high degree of inefficiency.
What to Do: If you’re holding a position and red bars start to show up at the extremes, it is time to take some profits or tighten up your stops. A red bar does not mean you’re going to see an immediate reversal; however, it does signify that there is significant resistance coming into play at this point. The days of easy money are over, and many professional traders will utilize red bars as an exit point, rather than an entry point.
For Example, the price of Bitcoin rises to an all-time high. The last leg of that rally created a red bar in the chart. The volume was huge on this bar; however, the range of the candle is extremely small. The number for the market facilitation index decreased, even with that tremendous amount of activity. This is an indication that it’s time to start scaling out for the smart trader. Within 48 hours, a 15% correction begins, and it would have likely been given as a warning via the red bar.
Combining Signals for Confirmation
Multiple bar alignments present the strongest trades. The trend is a stronger one when three consecutive green bars break out than when one green bar is followed by several brown bars. A reversal that consists of multiple consecutive red bars is more likely to be reliable than a standalone red bar.
Patience is the key when using the market facilitation index to help identify potential trades. A single green bar or red bar offers some level of information, but a pattern of multiple bars provides actionable intelligence.
Advanced Integration: MFI + Fractals + AC Triple Filter System
Market Facilitation Index is not a stand-alone indicator that can be traded by itself; it is part of a comprehensive trading system designed to allow using multiple indicators that confirm each other. By using the Market Facilitation Index (MFI) along with Fractal and Accelerator Oscillator (AC), they form a triple-filter setup that can increase the quality of your signals significantly.
Understanding the Components
Fractals are used to identify possible reversal points by defining bars (candlesticks) where the price has made a local peak or trough with the surrounding bars (candlesticks) making lower highs or higher lows. In essence, you can think of fractals as unemployment rates, support and resistance levels that the market has self-indicated.
Accelerator Oscillator (AC) is used to determine if momentum is increasing or decreasing. AC is simply the derivative of the Awesome Oscillator and displays both the direction of the momentum and the change of the momentum. When AC is moving into the positive (green) zone, momentum is building, whereas when AC is moving into the negative (red) zone, momentum is decreasing.
Market Facilitation Index is an indicator that judges the amount of buying and selling occurring in a given time period (currently). It indicates whether the market has a lot of conviction and sentiment behind it (green bars) or if the market is currently in a low-quality (blue or red) setup.
The Triple Confirmation Entry
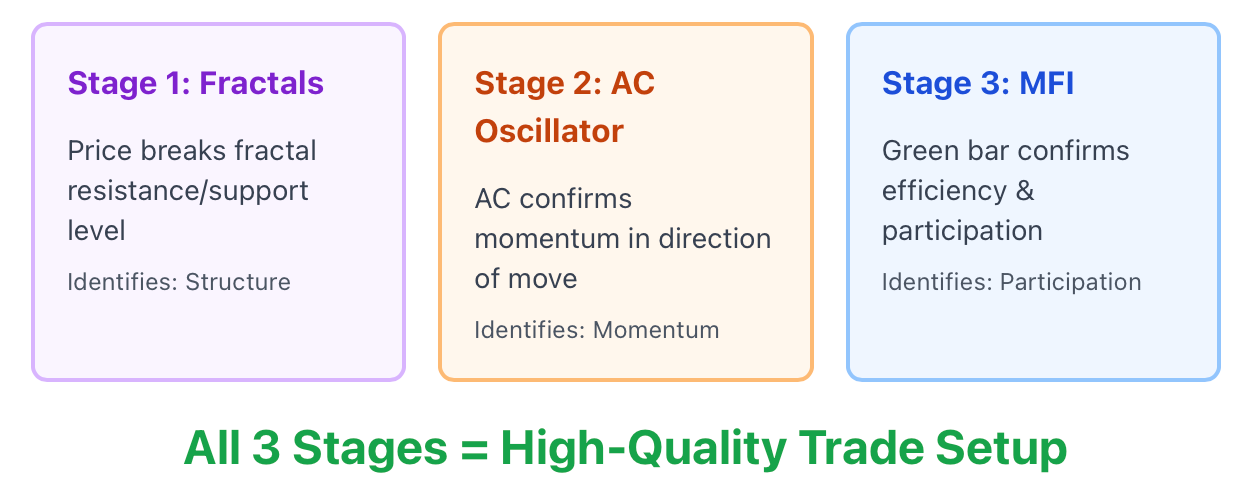
The highest-probability trades occur when all three indicators align:
Stage 1: The market has broken through a level of fractal resistance or support (i.e., price has closed above/below the fractal level). This indicates that there is a good chance of breaking out from the current market structure.
Stage 2: The Accumulation/Distribution indicator confirms whether or not momentum has been established in the direction that the price is moving. If the price has broken above the fractal level, then the AC indicator will be green and increasing, whereas if the price has broken below the fractal, then the AC indicator is red and decreasing. This confirms the momentum to support the price break.
Stage 3: When the Market Facilitation Index shows a green bar and both the MFI and Volume are increasing, it confirms that the breakout has enough efficiency and participation supporting it.
Entry Timing: Once all three stages are aligned, you have a high-quality confirmed breakout. In summary, fractals indicate where price has broken out, AC provides the reason(s) for the movement, and MFI informs us of market consensus.
Example Trade: EUR/USD Breakout
The price is nearing 1.1000, where it is close to an established fractal high. This fractal high was formed three days ago and has not been breached since. When the price reaches 1.1000, the Accumulation/Distribution (AC) has been trending upward for over two days, with the AC showing green bars for this same period. Consequently, momentum is on the rise.
The price is currently breaking above the 1.1000 level. Furthermore, the breakout candle is green on the Market Facilitation Index (MFI). Additionally, both the MFI and volume are increasing, thus providing you with three confirmations of a bullish move: the fractal break represents price action and structure, the AC being green indicates bullish momentum, and the MFI being green shows increased efficiency and participation from traders.
You decide to take a long position with a stop loss placed below the fractal low. Over the following two days, the trade produces an increase of 80 pips in your favour.
Example of What to Avoid: Gold False Breakout
Gold was able to break through a primary fractal resistance point. You are excited and ready to buy until you see that the market facilitation index indicates that the breakout candle was blue. The MFI was up, but the volume was down. While the attitude control (AC) was shown as green, the absence of volume participation raised a flag in your mind.
You choose not to enter the trade. For the following two hours, Gold had a reversal back down to below the breakout level. You were saved from losing your money because of the blue bar. Therefore, you can conclude that the market facilitation index served as your filter for preventing you from entering into a possible winning set-up that would have turned out to be unsuccessful.
Exit Rules Using the Triple System
If you know when to exit as well as when to enter, that's as vital as executing an exit successfully. The Market Facilitation Index helps provide clear exit signals.
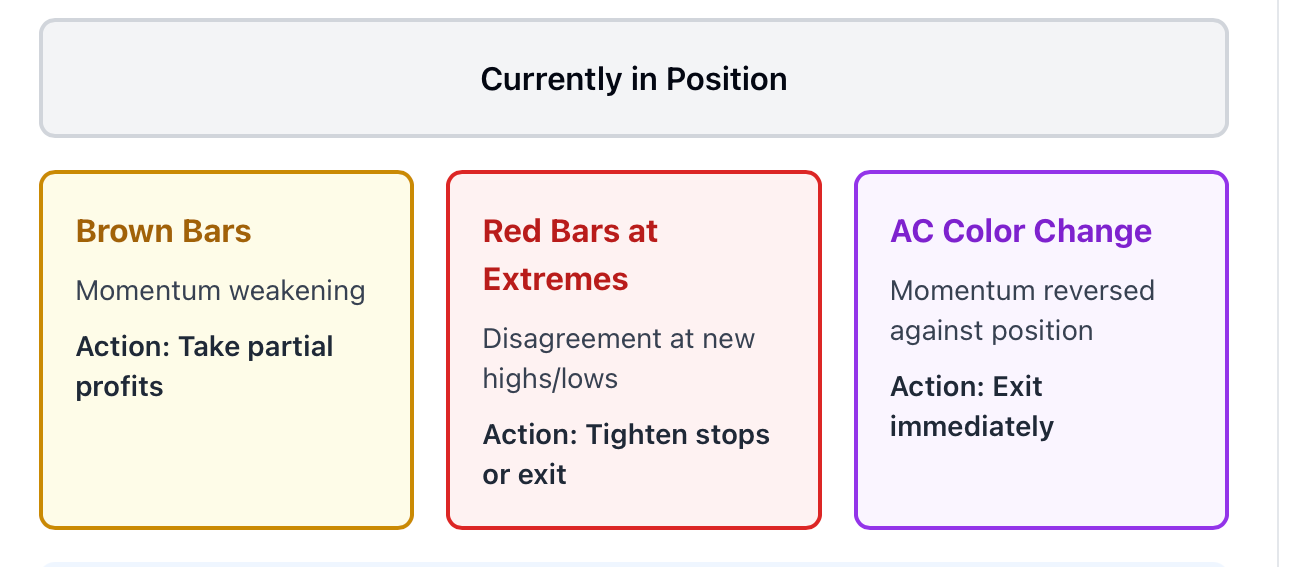
Brown Bars: You have consecutive brown bars while you are still holding your position, and if you see consecutive Brown bars, that means the momentum is a little bit weaker. The market is at a resting phase, and if you are sitting on profits that are really good, it might be a good idea to start taking partial profits, or stop your position altogether and let it settle down or go to Breakeven points. So, even though you are still in a trend does not mean you should continue to carry forward; at some point, you may get out and not carry the momentum any longer.
Red Bars at Extremes: If you have had a really strong trend and you suddenly see Red bars forming and price action is moving to new highs and/or new lows, that's a warning sign. A sudden increase in volume was followed by a decrease in efficiency (signifying disagreement among major market participants as to which direction the price will go). If this occurs, you need to tighten your stops or exit either way.
AC Momentum: If you notice that AC has changed colors against your position while at the same time showing Brown or Red bar signals on your Market Facilitation Index, that is a double confirmation that you need to exit. You are seeing confirmation from both the AC and Market Facilitation Index, therefore indicating that you are in the process of losing momentum as well as losing efficiency in your trade thesis.
Why the Triple System Works
Three separate indicators indicate a particular direction of price movement in the market, each measuring a specific aspect of market behaviour. The first indicator (the Fractal) identifies ways to study how the market is developing, specifically identifying structural levels.
The second indicator (AC) identifies ways to determine the momentum within the market.
And the third indicator (MFI) identifies the quality or strength of participation in the market.
When you can use all three indicators together, it is possible to trade with the "weight" of all aspects of the market (Structure, Momentum, and Participation) together.
Many traders lose money because they use one indicator alone. Many indicators produce both high- and low-quality signals; therefore, the use of MFI as a filter allows you to concentrate on only the highest-quality trades where all indicators confirm each other.
Conclusion & Optimization: Master MFI and Take Action
The market facilitation index (MFI) is a great tool, but it has limitations. Being aware of the limitations can help you utilize the MFI more effectively.
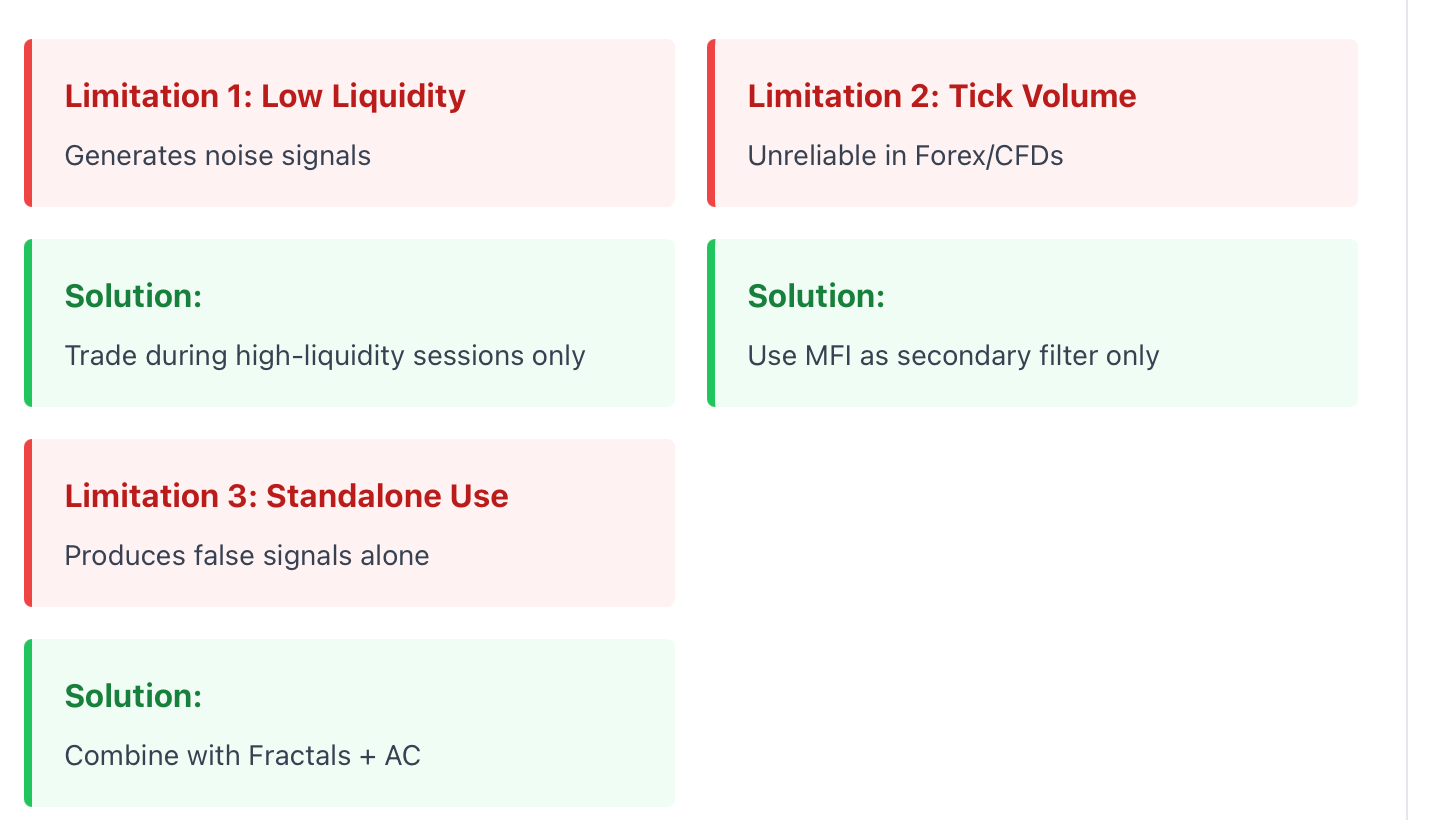
Limitation 1: Low Liquidity Sensitivity. In markets with low liquidity or during off-market hours, MFI will generate more "noise" signals. Asian foreign exchange trading hours, after-hours stock trading sessions, and holiday trading periods all produce unreliable MFI readings. Thus, the easiest solution is to only trade when there is plenty of liquidity in the market or to confirm MFI signals with additional indicators during low-liquidity trading periods.
Limitation 2: Tick Volume in Forex/CFD Markets. Without the availability of actual volume data, the MFI becomes less reliable when it is used in forex trading. Instead, you will see even more blue bars (overbought) and more false signal indications. The way to get around this problem is to treat the MFI as a secondary confirmation tool rather than as a primary signal generator. Use price movement or another indicator to determine direction, and then use MFI to provide an assessment of the quality of those setups.
Limitation 3: Works Best When Used Together with Other Events. When using the MFI by itself you are likely to make a mistake in making a trading decision. For instance, just because you see a green bar during a downtrend does not mean that you should enter a long position. Or, for example, if you are in a consolidation phase, seeing a red bar does not mean that a trend reversal is occurring. The key point is that MFI signals must be interpreted within the context of a larger market picture.
Optimization Strategies
Filter Noise With ATR: The Average True Range ( ATR ) Filter Value on a Chart will use ATR to delete periods of low volatility ( ATR below the 20-period Average ) where MFI Signals may be of little significance. MFI Signals will have less value or relevance when ATR is below its Average for the 20 days. The MFI works best when the trader has the opportunity to engage in trades in the direction that the market is moving.
Use Higher Timeframes, H4/Daily: The higher the MFI Indicator is plotted on a Chart, the more reliable it becomes, as it uses Volume Data, and Noise in the lower timeframes is higher. Day traders can utilize the MFI Indicator as well; however, it is better to utilize the MFI Indicator of a higher time frame, along with other MFI Indicators for better overall confidence.
Combine With AC + Fractals: We have previously discussed in-depth how to combine these three systems; however, it is worth repeating. The MFI can become a powerful Trading Tool when utilized in conjunction with the Bill Williams Complete Trading System. The combination of Fractals determines market structure, AC provides trade momentum, and MFI verifies the quality of the set-up through multiple confirmations.
The Core Insight
Efficiency is the primary focus of the Market Facilitation Index (MFI). The market does not move linearly. Instead, it will experience periods of high efficiency, which allow for the development of trends, and periods of low efficiency, which lead to either consolidation or reversal. The MFI enables you to assess the market's current state to determine if it supports trend-following strategies (green bars) or uses caution and/or counter-trend thinking (blue and red bars).
The higher the MFI's number is, the better the environment is for a trader to enter into a trend-following trade. The lower the MFI's number, but still trading at relatively high volumes, the better an investor is off to consider reversals or potentially do nothing.
Take Action
Ready to put the market facilitation index to work? Head over to btcdana.com and explore how Bill Williams' indicators can transform your trading.
Don't wait for the next false breakout to learn this lesson the hard way. Start using MFI today and discover what efficiency-based trading can do for your win rate.