


Why Market Timing Actually Matters
A lot of people think investing is as straightforward as finding some good stocks or coins, and waiting until you get a decent profit. Although this is a big part of investing, there is a huge, important part most beginners overlook. Often called timing.
Profit windows are the periods in the markets that will more than likely create better opportunities for a profitable trading position. Think about this like surfing. You may have the best board and wave riding skills, but if you paddle into the water at the wrong time, it's going to be a frustrating experience. If you end up catching the right wave, it all seems to come together.
What occurs in the markets will move more or less in patterns - up, down. However, these are not random price fluctuations. They will cycle, based on economic data, seasonal trends, investor psychology, events overseas, and all things that can drive market momentum. If you understand market cycles, you now have a bit of an edge, as you can position yourself before the trades are crowded.
A simple example is whenever Bitcoin prices begin to get volatile. The price really gets volatile around major economic announcements and also at the end of every quarter when all the big boys -institutional investors- are rebalancing their portfolios. By knowing the cycle you can prepare for the volatility rather than panic.
Professional fund managers take it a step further. They are tracking quarterly earnings reports and releases of GDP data will also be aware of fed meetings, to prepare for market impact. If -when- economic data suggests expansion, they will reposition into growth stocks within the equity markets. If they see data starting to point to economic contraction, they will rotate into defensive positions, or bonds, where other asset classes offer better value.
The key takeaway from all of this is cycles are not anything like a crystal ball to predict the future, but provide context. Rather than a guess, you are making reasonable decisions based on historical patterns and data that is present.
Break down Market Cycles More importantly, the market does not move in a straight line up or down.There are three primary types of markets: bull markets, bear markets, and sideways markets.
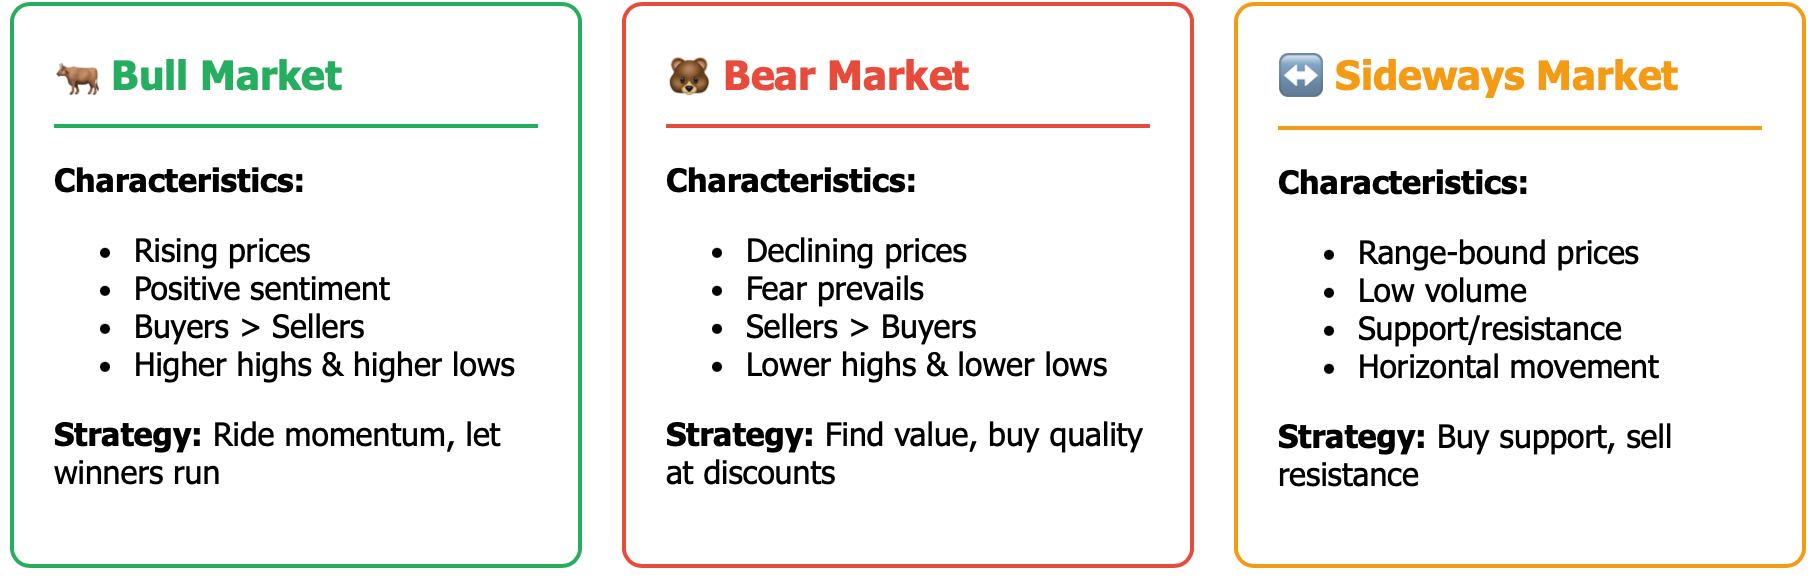
Bull markets last for an undisclosed period of time when prices move in an upward trend. The attitude surrounding the market is positive and buyers outnumber sellers, and every retreat in price is bought up. Bull markets can last anywhere from a couple of months to a couple of years, but during a bull run your plan is to go with the momentum and let your winners run.
In comparison, bear markets are pretty much the exact opposite of a bull market. Bear markets feature declining prices, fear prevails, and any short-term upward price movements get sold into. Bear markets can be exhausting and testing psychologically, however you can create some opportunities if you know where to look. Value investors tend to put positions on quality assets during bear markets by capturing deeply discounted assets.
Sideways markets are markets that move in price off of defined support and resistance levels, but are not clear in price direction. You will see volume shallow out, and volatility subside, and traders start to become bored. However, sideways markets can sometimes be the best trading environments for range bound traders, as they can buy the shares near support and sell the shares near resistance to realize a return on their investment.
Each of these cycles vary in their characteristics: bull markets show higher lows and higher highs, bear markets show lower highs and lower lows, and sideways markets show horizontal boundary resistance and support.
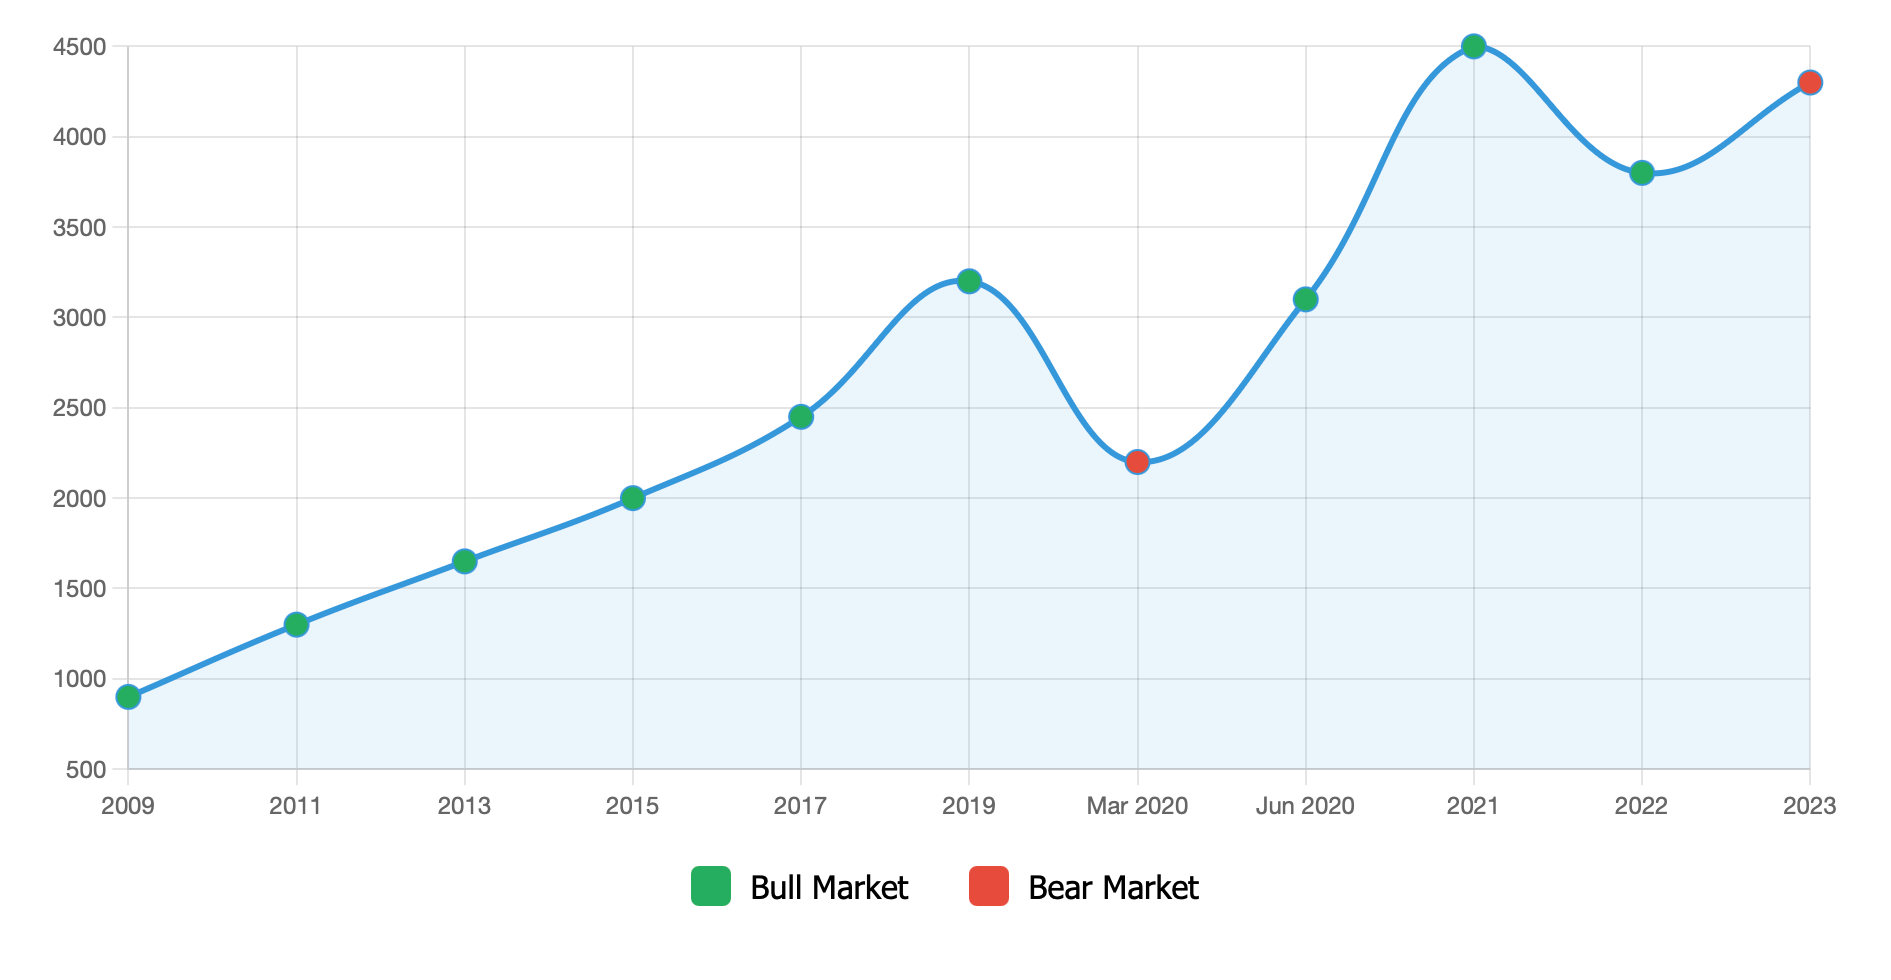
Now, consider the past decade of S&P 500 performance. The market was predominantly bullish from 2009-2020 except for short durations of price correction. Then COVID hits the world and the S&P500 experiences an extremely fast bear market in March of 2020, and then an incredible bull market recovery that some experts labelled price discovery. Then in 2022 we see another bear market again as interest rates continue to climb.
Forex markets behave in the same manner. For instance, we could visualize the EUR/USD trending in a strongly bearish fashion as a result of diverging economic data between Europe and the US, and then experience a sideways market when the policies between Europe and the US align.
Understanding which cycle you are in helps to figure out what appropriate strategy to use. Bull markets are more advantageous to success momentum trades; bear markets may bring rewards to the more experienced trader or simply patience with selected buying.Sideways market conditions necessitate having precise entry and exit points.
Economic cycles are the everything of investing
Market cycles reflect price action based on supply and demand, but economic cycles are the reason behind the price action. An economy will expand and contract in predictable cycles.
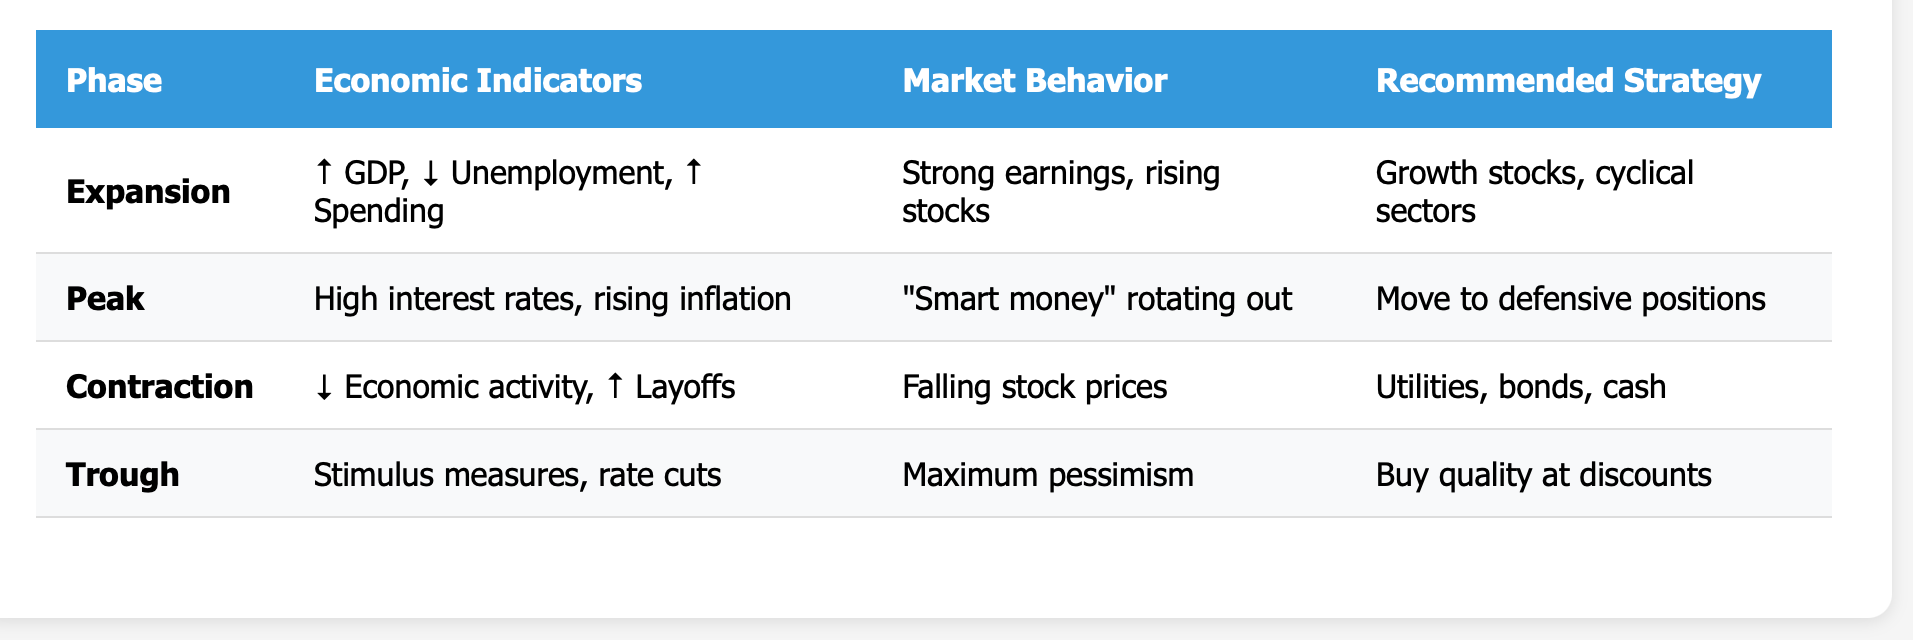
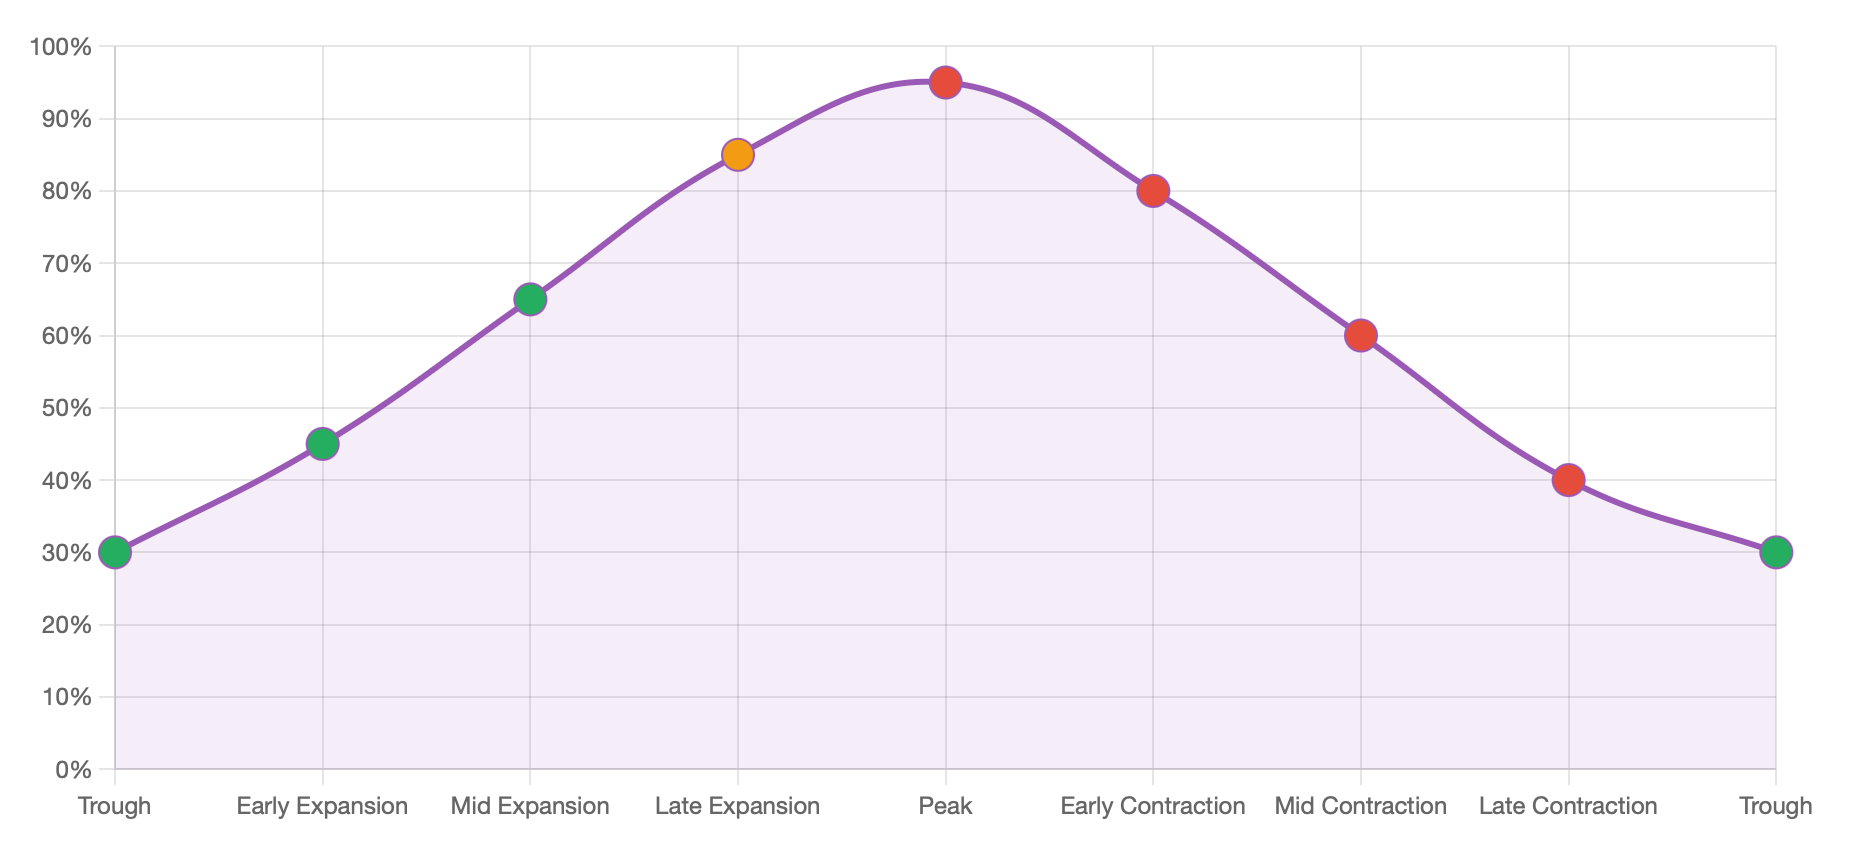
When an economy is in the expansion phase, GDP growth will be increasing, unemployment will be decreasing, and disposable income will be spent freely. Publicly traded companies will be reporting strong earnings, stock prices will be rallying to the upside, and appetite for growth (and therefore risk) will be increasing. This is the time that growth stocks, and cyclicals sectors tend to outperform the overall market.
Then we encounter the peak, the point of inflection where GDP maxes out. Interest rates are typically high, inflation may be rising, and the guidance in the forward markets becomes increasingly tentative. At the peak, we generally see "smart money" starting a rotation into defensive positions.
We're now entering the phase of contraction. Economic activity starts to slow, layoffs may begin to rise, or disposable income turns into savings. Stock prices typically decrease during an economic contraction although heavy defensive sectors (i.e., utilities, etc.) and fixed income securities can maintain their value.
At the bottom we have reached the trough. This is the point where it is the darkest before dawn, but there have been plenty of seeds of recovery planted through stimulus measures, interest rate cuts, and early cycle opportunities.
For most beginner investors, the simplest approach is simply purchasing broad market ETFs or blue-chip stock in an expansion phase, the rising tide floats most boats.
In contrast, professional investors may take a deeper dive into the market. During the latter months of the expansion phase, they may shift their exposure away from equities and back towards cash. As the economic cycle begins to move into contraction, they will look into buying quality companies with strong balance sheets at significant discounts to value. As the trough begins to develop in the economy the wholesale buying of undervalued assets occurs because they know recovery and the next expansion is coming.
If ever there was a perfect example of this, we witnessed it in the early days of the pandemic in 2020. The economy shrank, contracted, and reached the trough, all within a few weeks.However, understanding the combination of monetary stimulus, fiscal stimulus, and the eventual reopening, and purchasing at the trough, allowed investors to realize strong returns throughout the 2020-2021 expansion.
Combining Technical Analysis with Cycles
Understanding cycles is good, but how do you time your entries and exits? That's where technical analysis comes into play.
Technical analysis uses indicators to allow you the foresight of visualization on cycle transitions, and to indicate that the market shows specific opportunities. To be the most functional technical indicators, candlestick pattern identification, trendlines, RSI (Relative Strength Index) indicator, and MACD (Moving Average Convergence Divergence) indicator.
Candlestick charting shows current price action or sentiment. For example, after a lower-high (e.g., declining price movement), a bullish engulfing candlestick pattern might suggest a transition from cycle low to cycle high. On the other hand, when you observe a doji candlestick forming at resistance, that might either suggest indecision before the lower low is made, or the reversal before a lower high.
Trendlines provide connection points between a high or a low that could represent cycle direction. For example, if you observed a downtrend line being broken on volume, while going forward in price, that could indicate either a reversal from the bear phase to the bull phase.
The RSI tracks momentum. A reading that is below 30 might suggest the market is oversold (signaling potential cycle bottom), and similarly, a value at 70 or above suggests an overbought market (potential cycle top).
The MACD tracks when the trend changes via numerous moving average crossovers. When the MACD crosses above the signal line during an oversold period, that could signal a bullish entrant during the early transition into a bull cycle (from a bear).
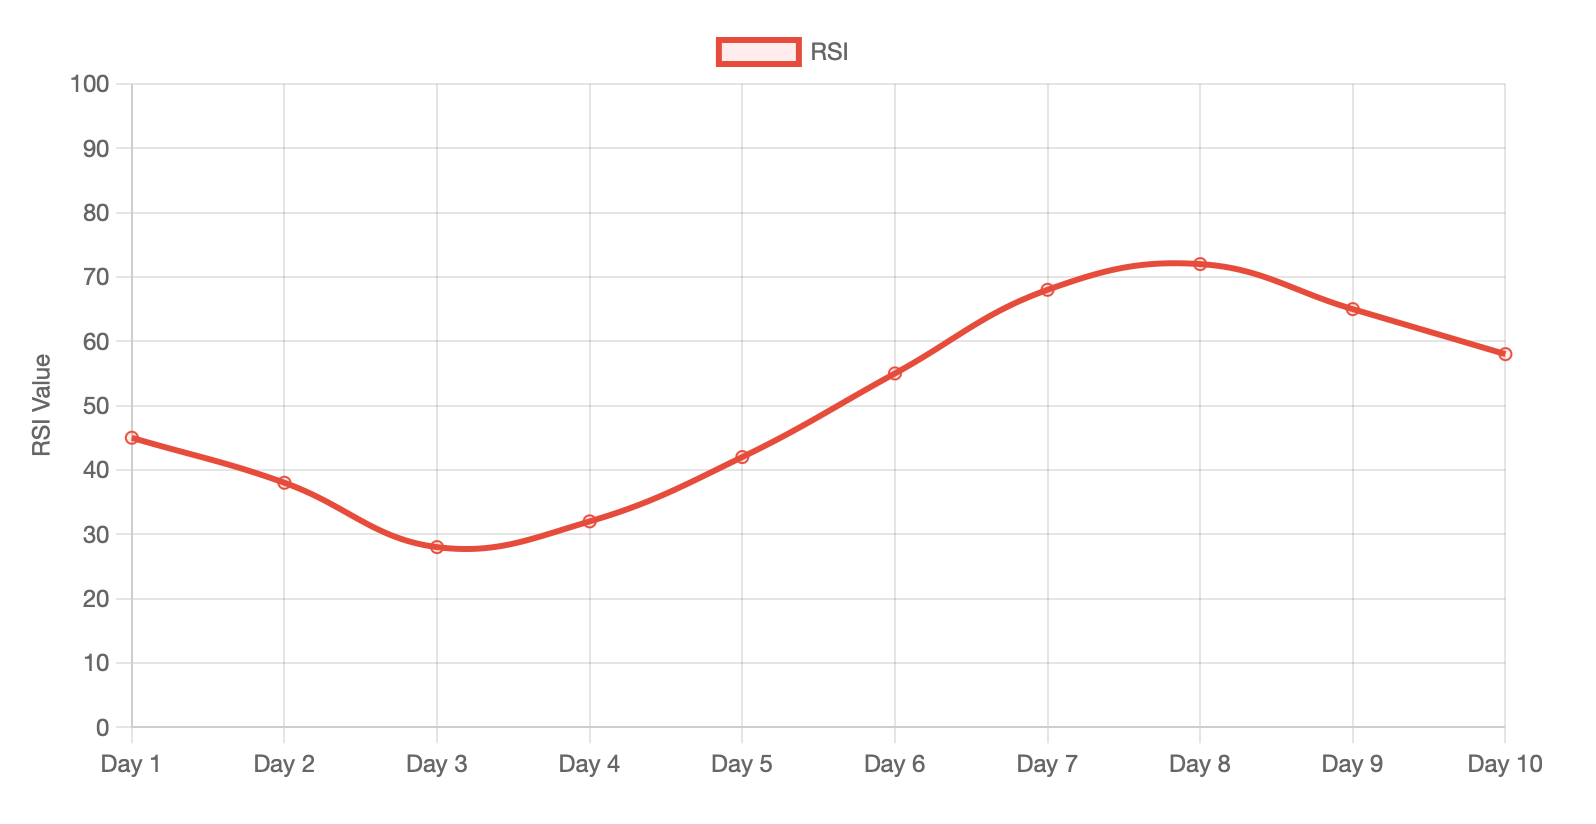
Let's say you're a beginner, but you had observed Bitcoin drop fairly rapidly three days in a row, decreasing toward a support level you identified weeks before. You might observe the RSI dropping to 28 (oversold), then you observe there is a bullish hammer candle forming right on support.The combination of these indicators implies a near-term cycle bottom, so you place a small position with a stop-loss below a support level.
Professional traders would layer this. A forex fund might look at quarterly GDP releases (an economic cycle), put MACD and RSI on their daily charts (a technical cycle) and only enter trades when macro and technical signals align.
The power is in the combo. Economic cycles give you a broader context. Technical indicators help you get the timing right. Together, you exponentially increase your probability of success.
Real-Life examples that did work
Theory is good, let's look at real life examples of where being cycle aware is paid.
Case 1: Tesla’s Post Drop Bounce (Late 2022)
Tesla dropped from ~$380 in early 2022 to <$110 by year-end. The broad market was in a bear cycle due to higher rates. But, by the end of December RSI was very oversold, insiders started buying, and year-end tax selling had ended.
Traders that recognized the cycle bottom would enter the position around $110-120, with a stop-loss around $100. When January 2023 rolled around, Tesla was up to $180+, for a gain of 60%+ in weeks.
The cycle signals were there: very oversold technicals + seasonal tax selling exhaustion + broader bear cycle approaching trough.
Case 2: S&P 500 COVID recovery (March - June 2020)
March 2020 was peak fear; the S&P 500 traded from 3,380 down to 2,190 in a month.However, the economic cycle exhibited traditional trough characteristics: substantial stimulus was introduced, rates were reduced to 0%, and economic activity remained frozen, albeit temporarily.
Investors who acquired the broad index funds close to the March lows saw the S&P rise to 3,100 by June, representing a return of +40% within a three-month time frame. The cycle's signal? Unprecedented monetary intervention along with oversold technical conditions.
The above shows that cycles strategy isn't about forecasting the future. It's about identifying cycles, managing risk, and putting yourself in position when you determine the probability favors upside vs downside.
Finding Your Rhythm in Trading
Not everyone should trade the same way. Your trading strategy should be in line with your goals, time commitment, and risk tolerance.
Short term trading (days to weeks) identifies smaller trading and investment cycles within the larger trend. Day traders and swing traders rely on technical indicators to capture momentum changes in short time frames; therefore, they must engage and monitor their positions at a rapid pace.
Medium-term investing for weeks to months generally align with quarterly or seasonal cycles. You may hold earnings through earnings seasons or scheduled economic data releases, adjusting your positions based on new data/information obtained. Medium-term trading/positions suit individuals working full-time but having enough time to check- in daily but not every hour.
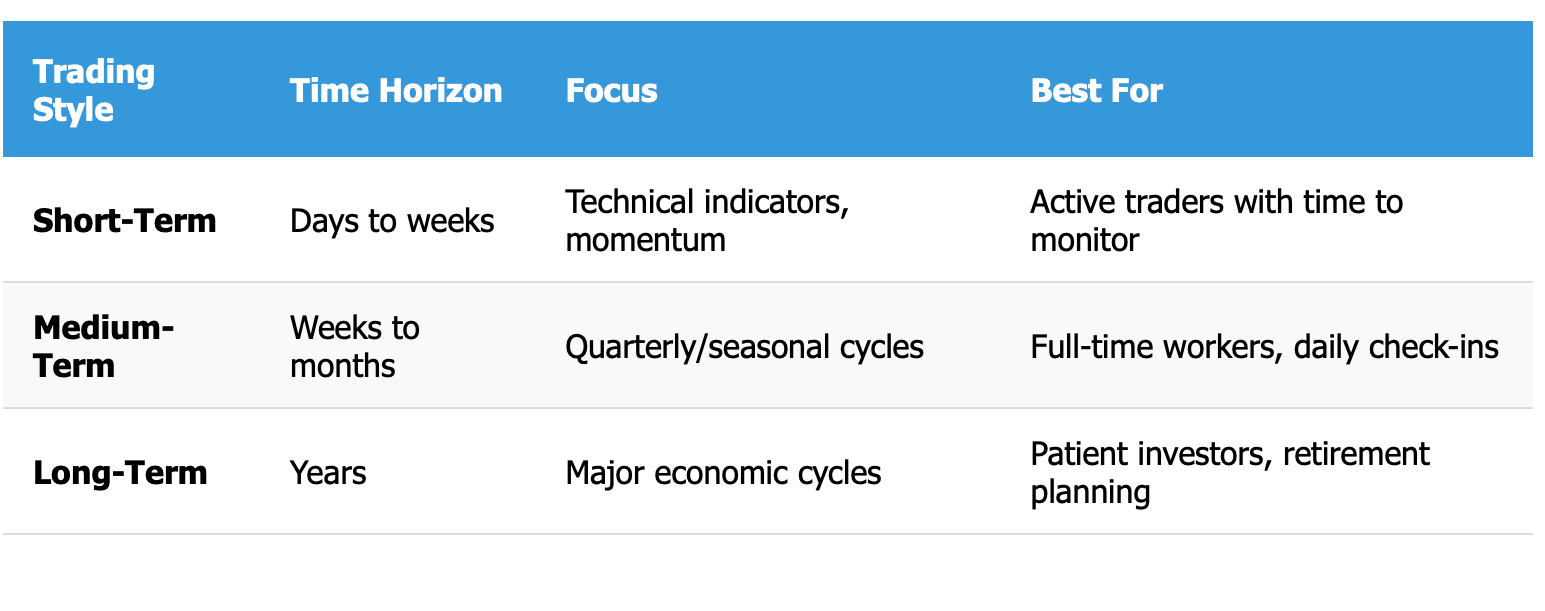
Long term investing (years) typically follows the major economic/the market cycles. A long term position is acquiring quality assets on bear markets or troughs and holding them through the expansion phase. This is the Warren Buffet style, as belief in valuation and effective holding period is more prevalent rather than timing the market.
For beginners, dollar cost averaging into ETFs or cryptocurrencies (if you believe in them) is generally a fair path. You are investing in fixed amounts on a regular basis, irrespective of the price, and dollar cost averaging will naturally accumulate lower prices (cycle lows) than higher prices.
Professionals will most likely rebalance every quarter or yearly, where the allocation is determined based on their view cycle. For instance, if the economy is in expansion, allocation will heavily favor equities. Equities will not be overweighted in the allocation when contraction appears to be on the horizon.
The right rhythm for your time commitment reduces stress and leads to better long term returns. Forcing yourself to trade short-term when it does not fit your time commitment or temperament can create significant mistakes. Similarly, playing longer when funds or income is necessary in a short period of time will not provide desired results. You have to be able to fit your approach to your reality.
Advanced: Cycles Plus Indicators Equals Precision
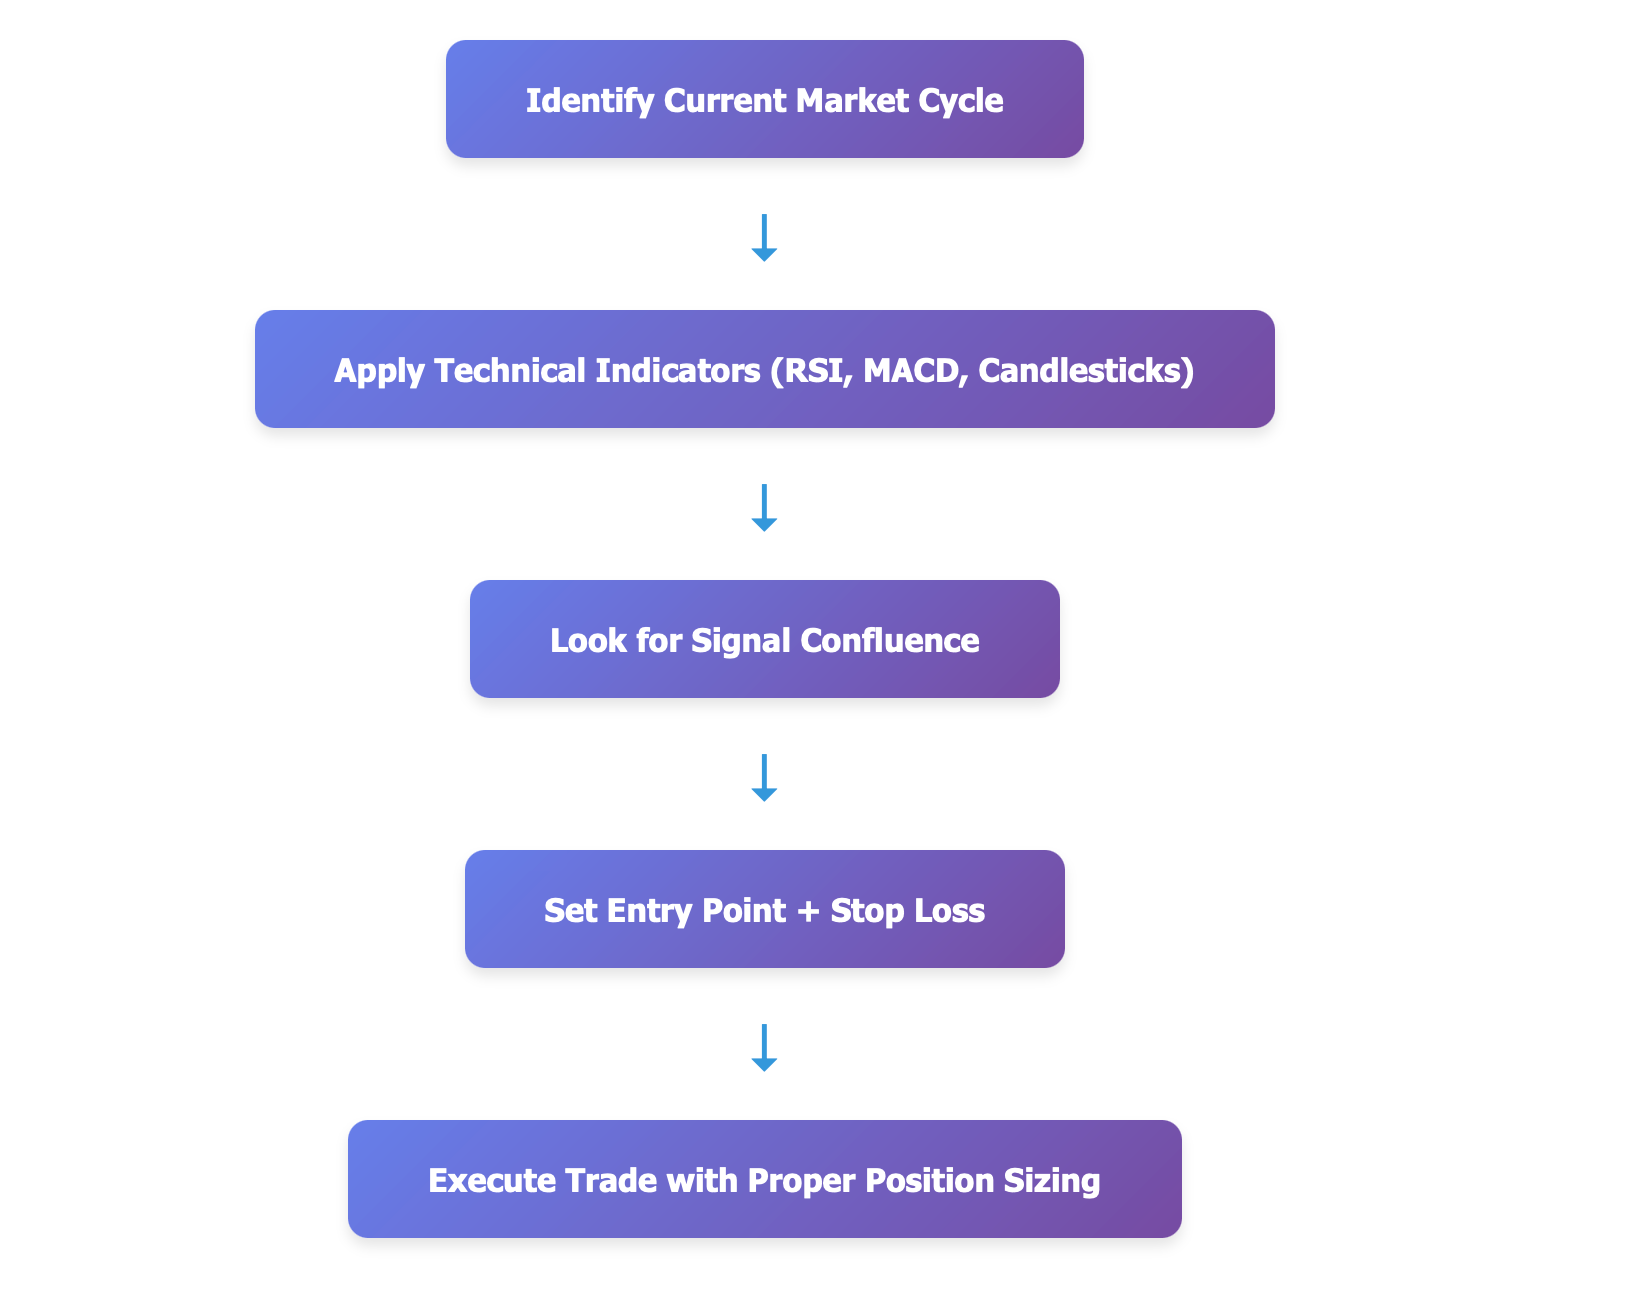
Once you are proficient in cycle recognition and technical analysis, utilizing the two together elevates your performance. The process is simple. First determine where you are in the economic/market cycle (expansion? contraction? Bull cycle? bear cycle?) and then consider technical indicators to identify technical entry against that cycle.
For example, you may be overall in a bull cycle; however, where prices in the bull cycle pull back to an identified support level, refer to the RSI and MACD. If both of these indicators suggest the prices are oversold, and show price divergence opportunities, that is a good indicator of a high probability entry. Stop-loss placements then would be beyond the recent cycle lows or technical support, and profit targets may be previous cycle high, resistance, or Fibonacci extension.
For instance, Bitcoin may be currently in a quarterly bull cycle. In this case, an institutional inflow and regulatory news may be indicators of this cycle. If the price pulls back about 15%, but still trades in the previous resistance zone (but now support), and the RSI shows in the area of 35 and the MACD shows bullish divergence, you may enter with a stop 5% below support and a profit target of the recent high (up approximately 20%).
Hedge funds do this all the time across multiple timeframes. They may have a long-term bullish view based on economic expansion; however, a hedge fund will trade around that position using daily and weekly technical signals that correlate to initial cycles.
The key takeaway from all of this is that cycles give you context and directional moves; technical indicators give you timing and precision; and risk management gives you stability and longevity. Once you put them together, then you have a complete system.
Long-Term Cycles: Income for Patient Investors
While opportunities often present themselves over days or weeks, some of the largest opportunities arise when one identifies long-term cycles lasting multiple years, and can allocate appropriately. Economic supercycles can endure for 7-10 years, or longer, if they gain momentum. Supercycles arise through foundational factors such as interest rate trends, demographic changes, technological shifts, and credit cycles.
The bull market from 2008 lasted for over a decade and was supported by ultra-low rates and quantitative easing (QE). Investors who identified that early, and remained invested throughout minor corrections, capitalized on some enormous market returns. Gold and commodities exhibit multi-year cycles that have an inverse relationship with the dollar, and a direct relationship with inflation expectations. From 2000 through 2011, gold appreciated from $250 to a peak of $1,900 as concerns about currency debasement and inflation peaked.
For investors, or those who are new to investing, simply investing in the index captures the benefit of long cycles of economic expansion. If you believe that over the next ten years, as is often the case, the economy will grow, then buying and holding a diversified index or ETF will allow you to ride the cycle without stress related to timing.
Professional investors will often reference cycles, or use cycles as part of their allocation strategy. In environments exhibiting low rates with an expanding money supply, they will overweight equities and actual assets. When rates normalize, and credit contracts, they will move towards fixed income and cash.
Cycles can also provide perspective for retirement and planning purposes. Young investors can withstand the variability and ride through the duration of cycles and bear markets due to their age. However, older investors approaching retirement need an awareness of cycles, with higher awareness in decision making related to reducing equity risk as the cycle matures.Long-term cycle investing may take some patience and is not sexy, but it works. Wealth accumulation is through compounding returns over full economic cycles.
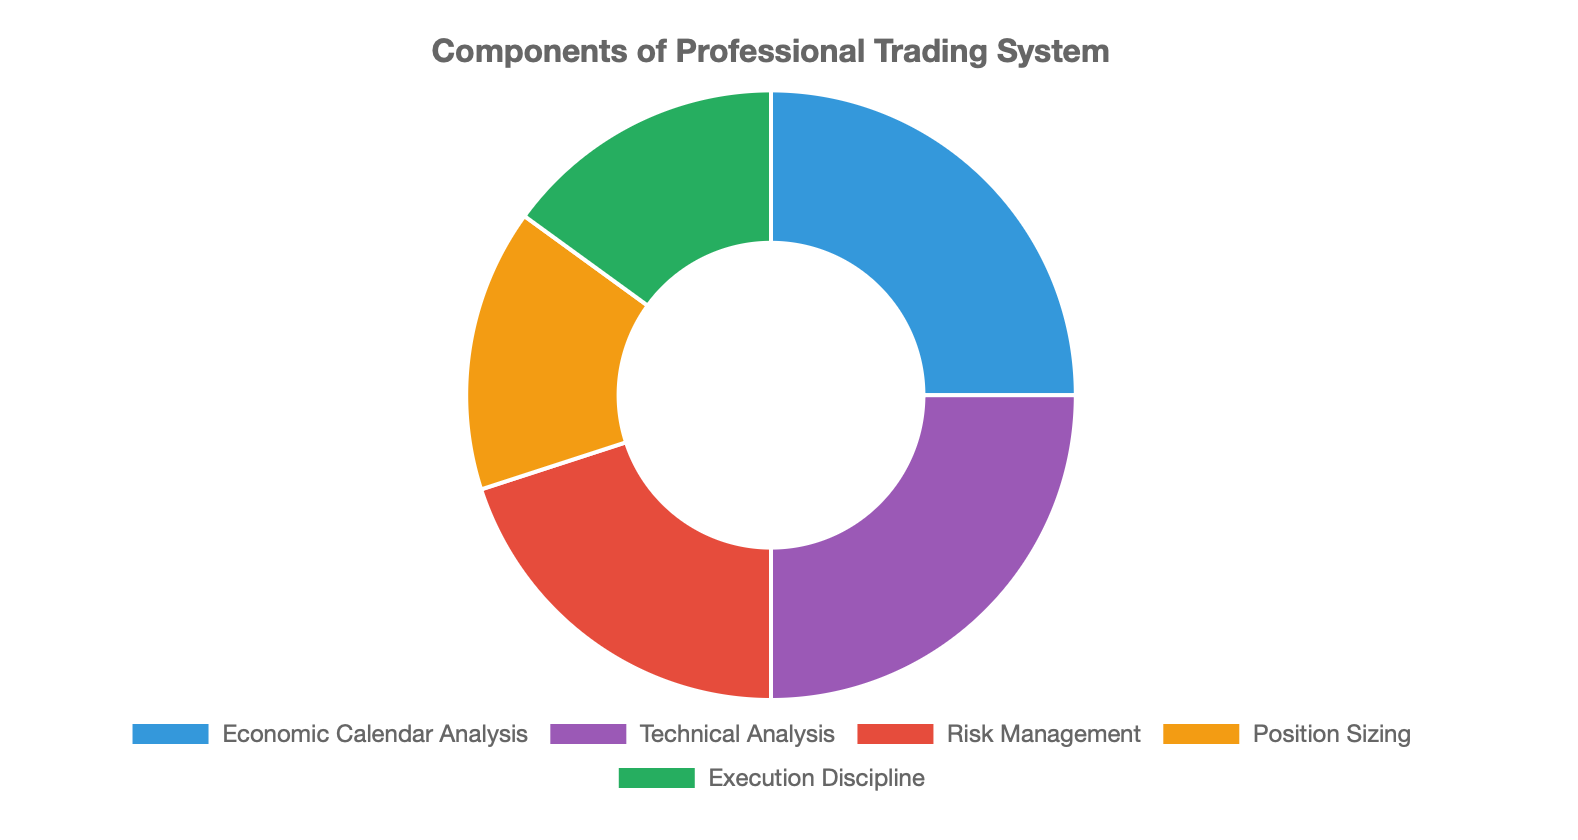
How the Pros Do It
The professionals do not guess. They have systems based on cycle designation, data collection, and disciplined execution.
They follow the economic calendar religiously. NFP (Non-Farm Payrolls), CPI (inflation), GDP releases, and Fed minutes all provide clues about the cycle. A run of strong economic data during early expansion years validates their bull positioning. When data is redirected downward at the peak of a cycle, the professional knows that the defensive position is proactive.
Next, the professionals layer on technical analysis. Institutional trading desks have algorithms they run that scan for cycle patterns along with technical setups across hundreds of instruments all at the same time, and once they see a synergy, they deploy positions.
There is always a risk management component to the professional investment process. Professionals never risk the farm on a single cycle call. Position sizing is determined based on how far away 'stop-loss' orders are from a given market price, and how much risk the account can handle. Generally, no more than 1-2 % of capital is risked in a single trade.
Hedge funds may have allocations of 60% equities in mid-cycle expansion, 30% bonds, and 10% alternatives. When cycle indicators start framing "peak potential", you may see those allocations shift to 40% equities, 40% bonds, and 20% cash and alternatives.
In Forex, institutions are always trading cycles around central bank policy. As soon as the Fed suggests the U.S. may be tightening, which indicates late-expansion the institutions (trust) will be buying the dollar. When the ECB lags behind on their policy, they're selling the euro. Again, cycles give directional context and 'technicals' provide important entry points.
If you want to find a way to think like a professional trader when it comes to long-term cycles, the best way to practice would be by 'paper-trading'. You can practice for free on 'demo accounts' that simulate real life and build the discipline of practicing your technical work along with cycle positioning. You can always take notes about what you 'thought' to be true, and the longer-term outcome regarding those decisions. Have some fun making daily decisions about your investments when the action doesn't cost you anything.
At the end of the day, the difference between professionals and amateurs are not secret indicators or inside information; it is discipline, building systems that respect, acknowledge, and leverage cycles rather than fight them.
Risk Management is Mandatory
Here's the hard truth. Cycle analysis can improve your probabilities but will never guarantee you will be right. Markets can remain irrational longer than you can remain solvent. Understand that risk management is the linchpin of profitable cycle trading. Position sizing, stop-losses, and diversification are likely a lot more important than being right on any specific trade.
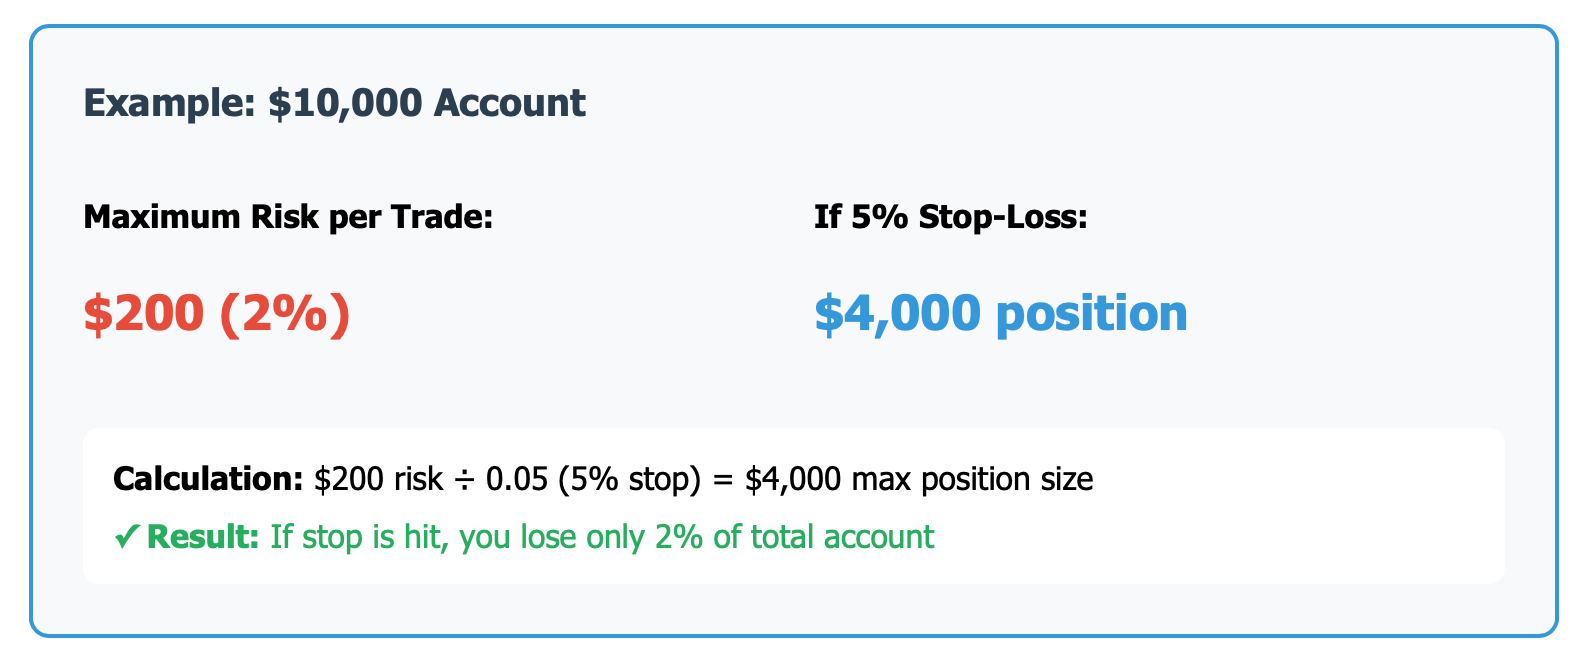
Always risk less than you can afford to lose. A commonly accepted rule is what is called the 1-2% rule. No one trade should risk not more than 1-2% of your total account. For example, if you have an account size of $10,000 and buy a stock and place a 5% stop-loss order on it, your total risk or investment should only be $4,000. This way, if your stop-loss gets triggered, you will lose only $200 ($200 is equal to a 2% loss to your total account).
Put stop-losses on every trade. Even if the cycle analysis has the potential to be a winner, the unexpected news could destroy a position in one night. Stops will mitigate otherwise catastrophic losses. The stop-loss should be just beyond a recent cycle low or a recent technical support area that gives the position at least a bit of room to break the level but hopefully still protects you from a loss beyond what you are willing to risk.
Crypto traders must be able to expect extreme volatility. Bitcoin can go down 30% in one week even during a bull cycle (it can go up 30% too). This is why it is crucial to get used to, and to maintain, smaller position sizes correctly mixed with wider stops (or tighter stops if actively managing). Otherwise, at the end of the day, you will just stop trading and give up due to the emotional toll.
Professional risk management also includes creating scenarios. What is the scenario if I'm wrong about this cycle? Where is my exit? If the scenario I am using to build a thesis changes, what is my plan? This kind of thinking creates an ability to be nimble instead of being attached to losing positions.
Diversification is another smart option as full risk management. Only investing into one trade at a time and on one asset cycle bet is not practical or wise. Diversification spreads investment to sectors, time-frames, or instruments. When one cycle call is a losing proposition or bet, losses can be offset by other position gains.
Long-term surviving traders are not the traders that never lose. They are the traders that keep their losses small and gain big while properly respecting risk.
Ready to put your cycle strategies into practice? Open a demo account now and practice these techniques with the real data in the markets with zero risk. Theory without practice is just trivia and that won't get you an edge in the game.